ClarkVision.com
| Home | Galleries | Articles | New | About | Contact |
Optimum Magnified Visual Angle
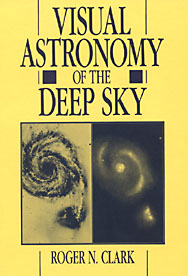
Visual Astronomy of the Deep Sky
Information on this page is copyright R. N. Clark, all rights reserved.
| Home | Galleries | Articles | New | About | Contact |
Information on this page is copyright R. N. Clark, all rights reserved.
This page is dedicated to amateur astronomy observing and discussions of how the eye operates in very faint light situations. The information is based on the my book and research I have done since publication of the book:
Clark, R.N., Visual Astronomy of the Deep Sky, Cambridge University Press and Sky Publishing, (book of 355 pages), 1990. Copyright Roger N. Clark and Sky Publishing. This book is referred to as "Visual Astronomy" from here on.
Information may be freely used and printed for personal non-profit use by amateur astronomers for their pursuit of visual observing.
Optimum Magnified Visual Angle
In the book "Visual Astronomy," I derived a concept called the Optimum Magnified Visual Angle (OMVA). This is the angle to which an observer looking through a telescope can detect the faintest and lowest contrast objects. Using data from a World War II study to help soldiers see better at night, I interpreted the data from the perspective of viewing through a telescope. A long held concept in amateur astronomy observing is to increase the magnification of a telescope to "increase the contrast of the object being viewed." While the effect is real, the explanation is incorrect. As one changes magnification, all objects change size (e.g. object and sky background), so the contrast stays constant. But the eye's sensitivity to contrast changes as the object size changes, with lower contrast objects easier to detect when they appear larger, meaning at higher power.
As one magnifies an object in a telescope, the object appears larger, but its surface brightness (e.g. apparent magnitude per square arc-second) decreases. If the object is magnified too much, its surface brightness may be too faint to see. While some magnification can help viewing, too much hurts. So, there appears to be an optimum. I derived the optimum curve in "Visual Astronomy" and here I discuss the concept and the confusion that has surfaced since publication of the book.
Contrast Discrimination
Visual astronomical observations depend not just on detecting faint light but also on contrast discrimination. Both abilities are involved in seeing such things as spiral arms of galaxies and dark rifts in nebulae, and in simply perceiving any object against the sky background. Contrast detection thresholds, as a function of background surface brightness for several object diameters, are plotted in Figure 2.5 from "Visual Astronomy". This diagram shows that, for a given background (e.g. the night sky), less contrast is needed to see a larger object.
Figure 2.5 from Visual Astronomy. The minimum contrast needed to detect an
object of a given angular size shown as a function of background
surface brightness, do. The larger an object appears to the
eye, the easier it is to detect. For small, bright objects on a
bright background, a contrast less than 0.01 is enough for
detection. But against the very dim night-sky background seen in
a telescope (fainter than 25 magnitudes per square arc-sec), a
large object must have a contrast of nearly 1.0, and a small
object more than 100, to be detected. Derived from data in Table
VIII of Blackwell (1946).
Critical Visual Angle
The data in Figure 2.5 were used to plot minimum detectable contrast versus angular size at constant values of background luminance to make Figure 2.6. Here we notice that for objects with small angular sizes, the smallest detectable contrast times the surface area is a constant. As an object becomes larger, this product is no longer constant. The angle at which the change occurs is called the critical visual angle. An object smaller than this angle is a point source as far as the eye is concerned. (A point can be considered the angular size smaller than which no detail can be seen.)
Figure 2.6 from Visual Astronomy. The smallest contrast needed to detect objects
of various sizes on various backgrounds. This diagram is the
most important one in the book, so it's worth taking the time to
figure out its complexities. This is the same data as in Figure
2.5, except that contrast detection ability is plotted against
angular size for various background surface brightnesses
(magnitude per square arc-second).
When an object is magnified in a telescope, the contrast between object and background does not change since both are magnified equally. However, the object becomes larger as viewed by the eye. Therefore, moving horizontally across the chart corresponds to increasing the magnification.
As we start with low magnification on the left side, the contours of background surface brightness are diagonal straight lines. At a point called the critical visual angle, the lines begin to curve. Objects smaller than this value appear as point sources (the smallest detail that can be distinguished). As one moves to the right of the critical visual angle line, the faintest detectable surface brightness decreases faster than the background surface brightness. Thus, fainter objects--or detail within objects--can be seen as magnification is increased.
This is true only until the "optimum magnified visual angle" is reached. Thereafter, higher magnification decreases the detection threshold faster than surface brightness. A faint object is most visible when magnified to this angle. Derived from data in Table VIII of Blackwell (1946).
This critical angle is shown in Figure 2.7a plotted for various background luminances. Figure 2.7a shows that as the background becomes fainter, the size of a "point source" becomes larger for objects that are just detectable. In other words, the eye's resolution or ability to see detail is much coarser in the dark.
Figure 2.7a from Visual Astronomy. The eye's resolving power, unlike a camera's
depends on an object's surface brightness. The critical visual
angle is the angle below which no detail can be seen and objects
appear as point sources.
Optimum Magnified Visual Angle
A low-contrast object is more easily detected if it is larger. For an extended object such as a galaxy viewed in a telescope, magnification does not change the contrast with the background, because both the sky's and the object's surface brightnesses are affected equally. Some visual observers have stated that a dim object's contrast with the sky background increases with higher magnification, but this is clearly wrong. The contrast merely looks greater because of the increased detection capabilities of the eye. Clark (1990) coined a name for the maximum magnification that will help detection: the "optimum magnified visual angle" (OMVA). This angle is shown in Figure 2.6 and also Figure 2.7b.
Figure 2.7b from Visual Astronomy. The "optimum magnified visual angle" of an
object depends on surface brightness. This angle is the size for
which a faint object, or detail within an object, should be
magnified in order to maximize the possibility of detection.
If an object is at the threshold of detection and smaller
than the optimum angle, more magnification will make it easier to
see. When the object is magnified beyond the optimum angle, its
surface brightness decreases faster than the eye's contrast
detection threshold, and the object will become harder to
detect. Remember that even for an object somewhat above the
detection threshold, higher magnification may bring out details
within the object that are smaller than the optimum angle at a
lower magnification.
Controversy
There has been a fair amount of confusion, discussion and criticism over this concept. Here are some links:
an investigation into the visual Optimum Detection Magnification, by Mel Bartels
In a long public and private email series among the above authors, we tried to understand each others points and to try and figure out what is correct (this was not simple). These discussions ended without full resolution of the issues. However, we did learn a few things.
First, two general methods were being used to derive the OMVA.
I derived the original OMVA by hand methods in the early 1980s before I had the modern computer tools, but using method 2 above. Nils Olof Carlin and I generally used method 2 and the Mel Bartels page above uses method 1. In our long discussions, and on the pages above, the other authors have yet to derive a new OMVA curve.
Some of the disagreement centered on my saying the OMVA occurs at a slope of -1 on the curves of constant surface brightness in Figure 2.6. Derivations by others in our discussions came out with a slope of -2. But I think people are solving different problems (e.g. the method 1 above). Methods which change contrast while changing magnification in a telescope are incorrect in my view, because the contrast of extended objects does not change when you change magnification in a telescope. This fact, I believe, is the root cause of much of the confusion.
When one magnifies an object in a telescope, one moves horizontally across the Figure 2.6 diagram. The object gets larger proportional to the magnification, m, but the surface brightness decreases in proportion to 1/m2. So it is the horizontal spacing of the surface brightness curves in Figure 2.6 that controls where the optimum is located. If the slope is steeper than -1 on the Figure, increasing magnification helps detection. As the slope of the surface brightness curves becomes more horizontal, the spacing stretches out (in constant contrast, or horizontally) and one loses detection ability due to loss in surface brightness faster than one gains by increasing the apparent size. This trade point occurs at a slope of -1. This is the optimum. On this point, at least some of the others (above) probably still disagree. Perhaps after reading this page, we can collectively go over the data, including the new data I present below, and derive a better solution.
Regardless of where the correct optimum is, the data I present below shows the optimum is a shallow function, and if you follow the advice in the very last paragraph, you will observe all detail close enough to the optimum that this academic disagreement is meaningless in practice.
One thing that came of our discussions, the Optimum Detection Magnifications in Appendix F of Visual Astronomy (in which I used method 1 in a way I didn't realize until these discussions) is wrong. Do not use it! The program I wrote changes contrast and thus is flawed.
However, the "Minimum Optimum Detection Magnification" (MDM) in Appendix E is still correct to the best of my knowledge.
So what does all this mean?
What few people realize is that the data presented in Figure 2.5 and 2.6 are projections of a 3-dimensional surface onto 2-dimensional graphs. The 3-D surface is shown below in Figure A.
Figure A. The "Blackwell Surface" for threshold detection. Detection of a faint
object by a visual observer depends on 3 things: 1) surface brightness of the object,
2) the object's angular size, and 3) the contrast with the background. An object
is detectable if it plots on the surface or above it.
Figure 2.5 is the projection of Figure A to the upper left plane. Figure 2.6 is the projection of the data onto the upper right plane. The third projection is the floor and is shown below in Figure B.
Figure B. The threshold contrast as a function of apparent angular size and
surface brightness. The curves on the plot are constant contrast. The red
diagonal lines represent the magnification trend in a telescope. The optimum
magnified visual angle (OMVA) occurs tangent to a contrast curve. The white
line shows my new derivation of the OMVA, first presented at the May 2001 Riverside
Telescope Makers Convention (RTMC). The idea for this derivation was first
presented to me by _______ of England in 19__ (I'm searching for this letter).
The OMVA in Figure B shows a second way to look at the Blackwell data and derive the OMVA. As one can see from the tangent points, and considering the data have been re-interpolated a couple of times, one might wonder how accurate the derivation of and OMVA is. Let's look at another way to check what the OMVA is.
The Minimum Aperture Needed to Detect M57 as a Ring
A simple method to check the OMVA is actual observations of simple deep-sky objects. An excellent object is M57. What is the minimum aperture needed to detect the ring nature of the object as a function of magnification? For this test, I did it in one night when the object was overhead and used aperture masks, so variations in sky conditions was minimal and telescope transmission was a constant. The results are shown in Figures C and D.
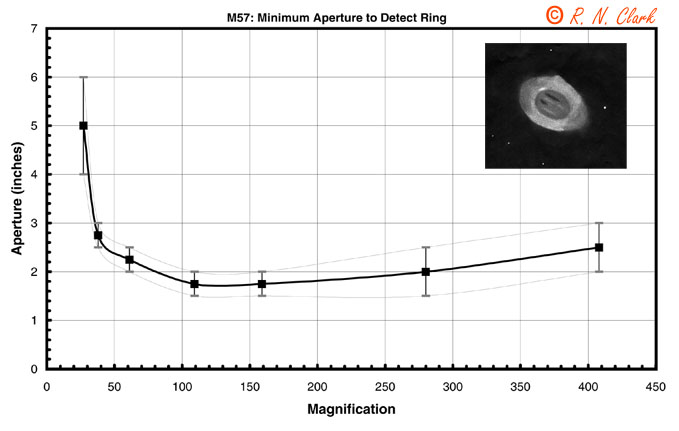
Figure C. The minimum aperture needed to detect the ring nature of M57 at
various magnifications. The curve shows the "barely" to "easy" apertures as
the bottom and top curves, respectively. The average of the barely and easy
is shown as the heavy line. The image is an M57 drawing using my 12.5-inch telescope
and many magnifications.
The central hole is about 3/4 arc-minute across. The minimum aperture occurs at a magnification of about 130x (+/- 30), which means the optimum diameter occurs at about 100 arc-minutes as viewed by your eye. The background surface brightness is about 25.5 magnitudes /square arc-second (including 0.4 mag/sq. arc-sec. for transmission loss in the telescope).
Figure D. The mean surface brightness of M57 as a function of
magnification when it is just detectable at each aperture in Figure C.
Note how shallow the minimum is in the M57 ring detection experiment in Figure C. The OMVA is not a precise value.
Now let's try and determine the OMVA at the brighter surface brightnesses. Click on the figure below to see a test chart of low contrast spots of various sizes.

If you print this chart at 300 dpi, and hold it at 30 inches from your eye, the 27 pixel diameter spots appear about 10.3 arc-minutes across. Viewing the chart in low room light gets near the right side of Figure 2.7b. For the low contrast spots, how large do they have to be to be seen (just above the threshold)? I tried some various lighting conditions and found a range of about 6 to 13 arc-minutes were needed to detect the low contrast spots (e.g. the 2 DN brighter than the background). I did the experiment before computing the spot sizes so I did not know what the outcome would be.
Plotting the M57 point, the low contrast spot experiment, along with OMVA from Figure 2.6 and Figure B, we see the result in Figure E, below.
Figure E. OMVA from Figure 2.6 and Figure B and the derived point from
the M57 experiment.
Conclusions
The new Optimum Magnified Visual Angle (OMVA) curve (Figure E, red line) is much more complex than the original OMVA curve (Figure E, black line). However, both indicate a general upward trend of increasing apparent angular size with decreasing surface brightness. Which is correct? It appears that the original OMVA agrees with observational data so far, but more precise data are needed to be sure. I do not think the OMVA data are good enough with the interpolations that have been done (starting with Blackwell, 1946). It is clear that the OMVA has a broad minimum. It is also clear that the OMVA for very faint objects is on the order of 0.5 to 1.5 degrees (it may be more than about 100 arc-minutes at the faint end).
Thus, the observing strategy to detect deep-sky objects, or detail within objects, is to magnify those objects, or detail within the objects. so they appear about 100 arc-minutes in size. For example, if you are trying to detect a dark nebula in a galaxy arm, magnify that dark nebula so that it appears about a degree across or more.
What Does All This Mean?
To see all the detail in an object, use many powers, from very low to very high, examining the entire object with each magnification. Because the OMVA appears to be a shallow minimum, one need not be precisely on the optimum. Within a factor of 2 or a little less in magnification is fine. A magnification sequence of: 35x, 50x, 80x, 120x, 180x, 270x, 400x ... (a sequence increasing magnification by a factor of about 1.5) is great.
References
Blackwell, R.H., Contrast Thresholds of the Human Eye, Journal of the Optical Society of America, v36, p624-643, 1946.
Clark, R.N., Visual Astronomy of the Deep Sky, Cambridge University Press and Sky Publishing, 355pp., 1990.
Clarkvision Visual Astronomy Main Page
| Home | Galleries | Articles | New | About | Contact |
This page URL:
http://clarkvision.com/visastro/omva1
First published February, 2002.
Last Modified December 18, 2007