| Home | Galleries | Articles | Reviews | Best Gear | Science | New | About | Contact |
| Home | Galleries | Articles | Reviews | Best Gear | Science | New | About | Contact |
Detection and mapping of minerals, vegetation species, chemicals, liquids, and solids is being done through the field of imaging spectroscopy. Imaging spectrometers are deployed on aircraft, spacecraft (throughout the Solar System) in the field, and in laboratories. Imaging spectrometers are narrow-band imagers with hundreds of wavelengths (bands) and usually include ultraviolet to infrared. Imaging spectrometers collect a spectrum at each image pixel with enough spectral resolution to resolve absorption and emission features in spectra of compounds, whether crystalline or amorphous solids, liquids and gases. What can be detected remotely is mainly a function of spectral range and resolution. Analysis of imaging spectrometer data sets is quite complex and the most advanced system system in existence is the Tetracorder system first described in detail in Clark et al. J. Geophysical Research in 2003 (PDF, 8.3 MBytes).
Tetracorder is in use analyzing data from all over the Solar System, including mapping ice and other compounds on icy satellite surfaces in the Saturn and Jupiter systems, minerals on Mars, and was critical in making the discovery of widespread water on the Moon possible. Tetracorder is used for mapping ecosystems, and in rapid response to environmental disasters. It was used in assessing the environmental damage from the World Trade Center disaster and in the 2010 Deepwater Horizon oil spill in the Gulf of Mexico.
The original Tetracorder has been extended to detect more materials at lower abundances and to cover a greater spectral range with automatic adaptation of sensor capabilities (currently Tetracorder 5.2).
Tetracorder uses multiple algorithms, including spectral fitting procedures to identify materials, and derives feature strengths (relative abundance) of those materials. It has demonstrated discrimination of grain sizes for some materials using the shape of the absorption features. The grain sizes and feature strengths can then be fed into radiative transfer models to derive component abundances.
Tetracorder 5.x+ adapts to both environmental conditions as well as instrument capability. Previous versions had to be adapted by an expert spectroscopist for each sensor and environment the data came from. Tetracorder produces maps of hundreds of materials, including chemical substitutions in some minerals. Imagine doing chemistry remotely, whether across a canyon, from a high point overlooking an environmental disaster, or a studying remote planets. This is now possible. Further, Tetracorder results can be made into custom color-coded maps automatically (examples below).
Tetracorder is the mineral identification used used for the NASA Earth Surface Mineral Dust Source Investigation (EMIT) imaging spectrometer instrument that will go on the International Space Station in July 2022. EMIT will determine the mineral composition of natural sources that produce dust aerosols around the world. By measuring in detail which minerals make up the dust, EMIT will help to answer the essential question of whether this type of aerosol warms or cools the atmosphere. Tetracorder is currently running on a Beowulf cluster at the Jet Propulsion Laboratory in Pasadena, California.
The latest Tetracorder is open source and available on github. The complete system includes the needed spectral libraries and as of 2022 is about 2.2 gigabytes of code + data and nearly 200,000 lines of code. The system runs on unix and linux. Get the tetracorder system on github: https://github.com/PSI-edu/spectroscopy-tetracorder. The spectral libraries include the U. S. Geological Survey library splib06.
Tetracorder training videos are on The Planetary Science Institute youtube channel: https://www.youtube.com/user/PSITucson/featured. Go down to "Spectroscopy and Tetracorder Training" and click on "PLAY ALL" to see all the training videos (listed on the right).
Examples of automated map production, a selection of materials identified and mapped are shown below.
The Salton Sea region Tetracorder results are shown in Figures 1 - 5. The NASA Airborne Visible/Infrared Imaging Spectrometer (AVIRIS) system was flown in an array, the data mosaicked and calibrated to surface reflectance. The mosaic was then mapped with Tetracorder. Mapping water on the Moon is shown in Figure 6. Mapping a hydrothermal system on Earth is shown in Figure 7, and on Mars in Figure 8. Figures 9 and 10 illustrate other standard mapping products, there using data from the Compact Reconnaissance Imaging Spectrometer for Mars (CRISM) on the Mars Reconnaissance Orbiter. Example results from Tetracorder mapping in the Saturn system are shone in Figures 11 and 12.
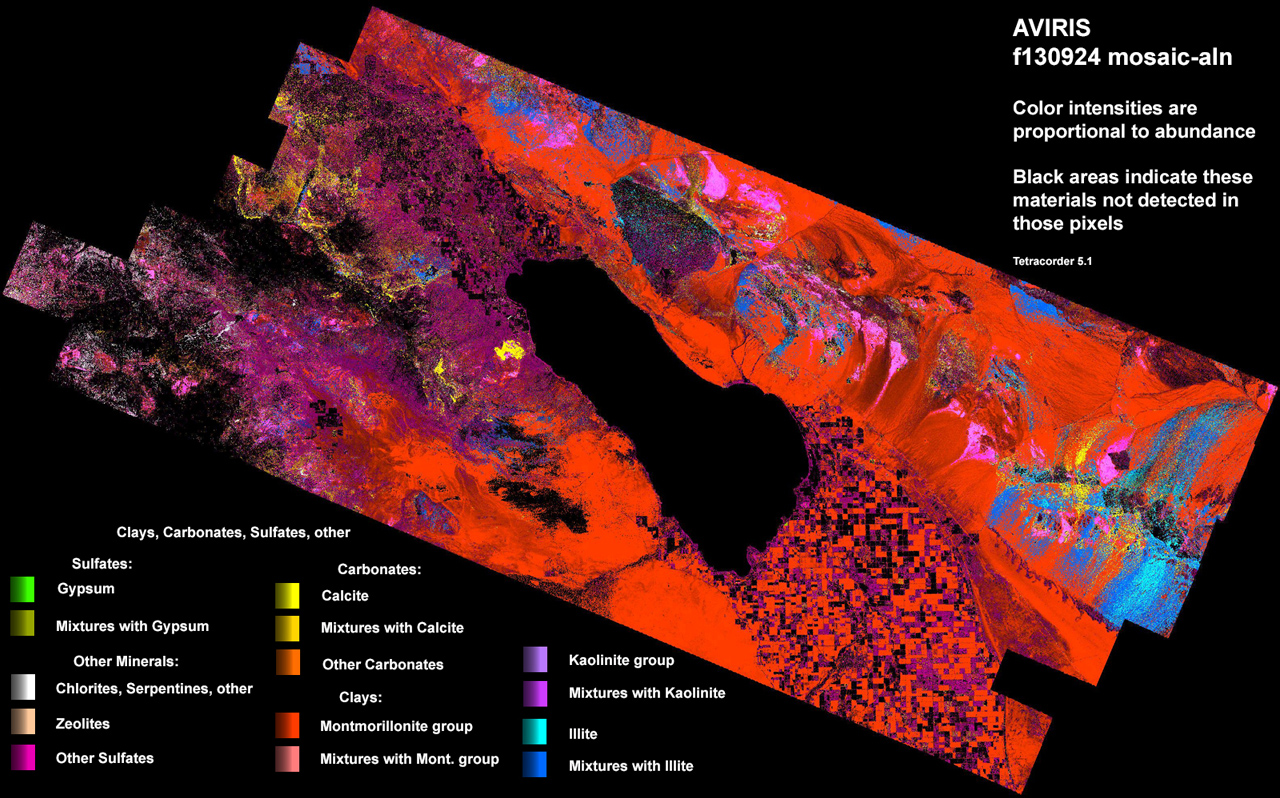
Figure 1. Tetracorder map of clays, carbonates sulfates and other minerals
using absorption bands in the 1.5 - 2.5 micron region (15,000 - 25,000
nanometers) for the Salton Sea region in California. This is a
reduced version of full resolution standard Tetracorder product.
All signatures should be checked for accuracy as calibration can throw off
identifications, and check that the Tetracorder expert system adequately
covered the environment.
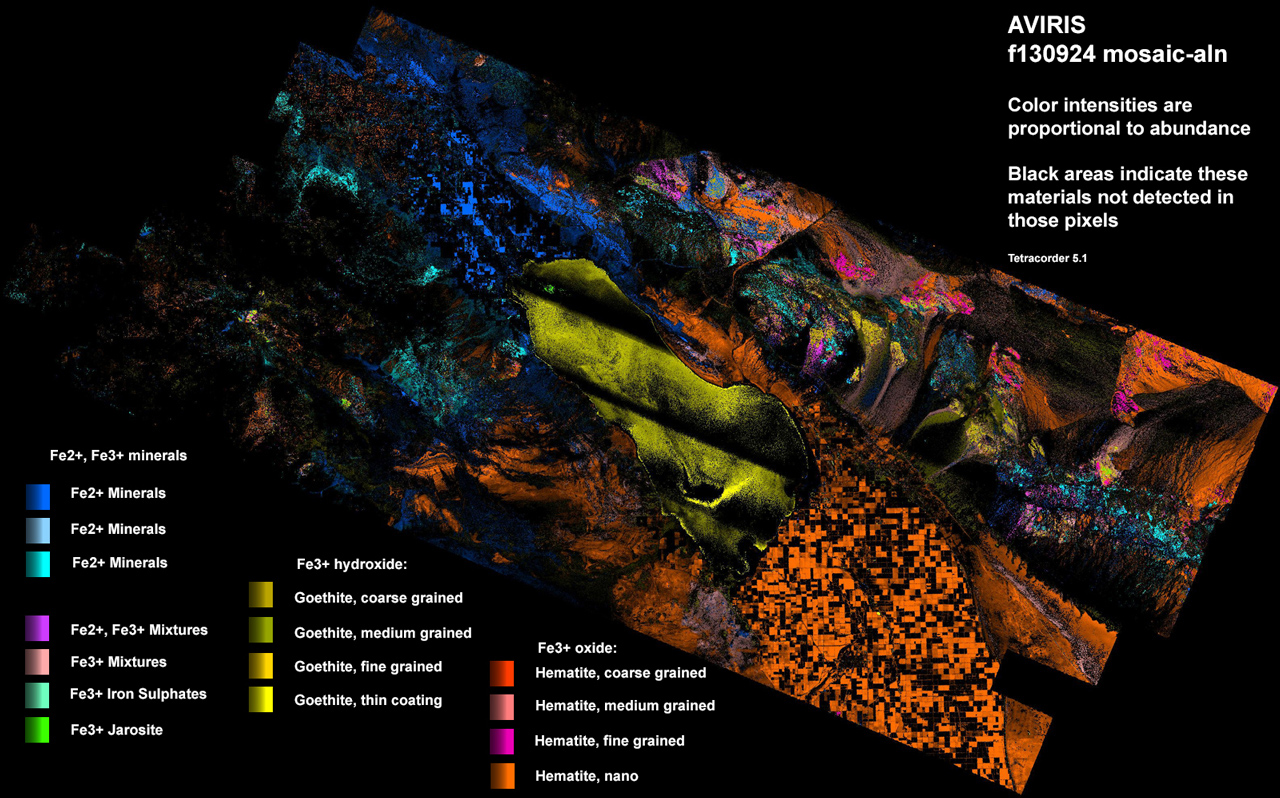
Figure 2. Tetracorder map of iron-bearing minerals using absorption
bands in the UV to near-IR spectral region.. This is a reduced version
of full resolution standard Tetracorder product.
All signatures should be checked for accuracy as calibration can throw off
identifications, and check that the Tetracorder expert system adequately covered
the environment.
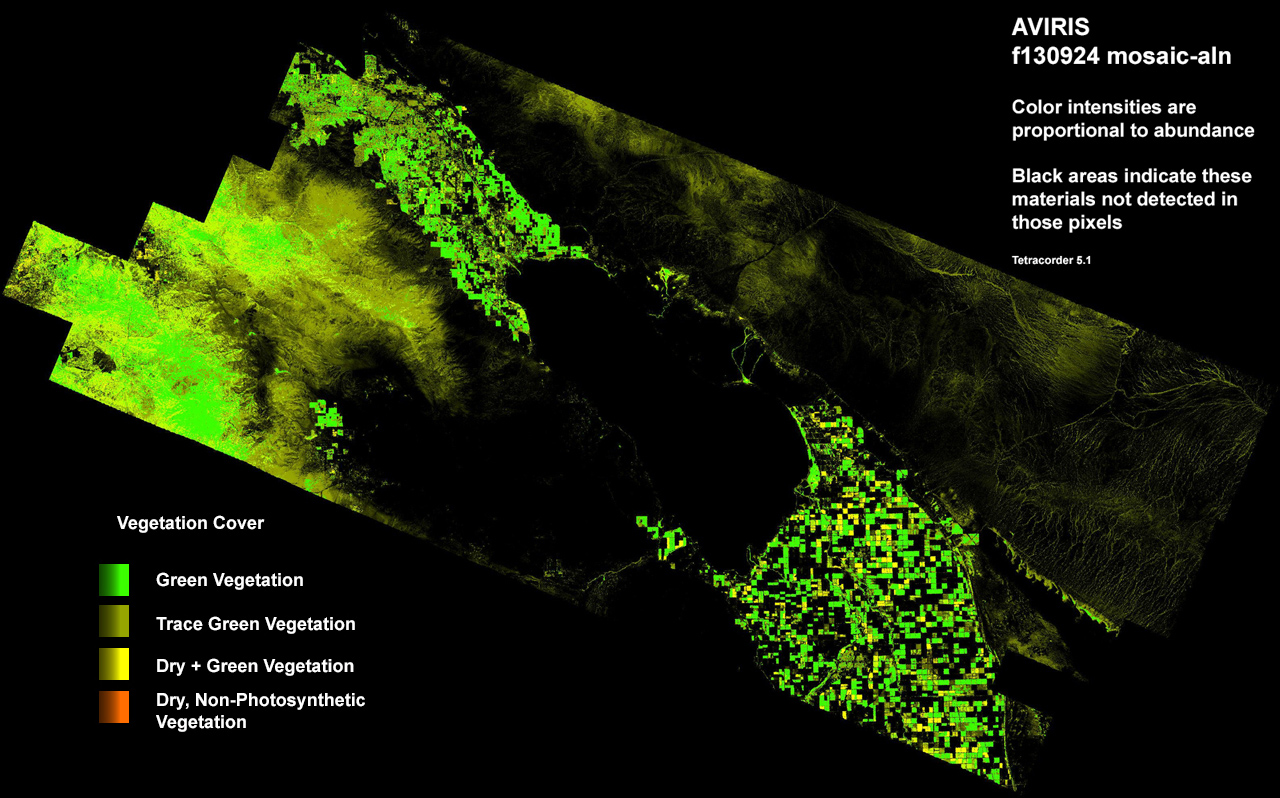
Figure 3. Tetracorder map of vegetation cover. This is more accurate than the commonly used NDVI.
This is a reduced version of full resolution standard Tetracorder product.
All signatures should be checked for accuracy as calibration can throw off
identifications, and check that the Tetracorder expert system adequately covered
the environment.
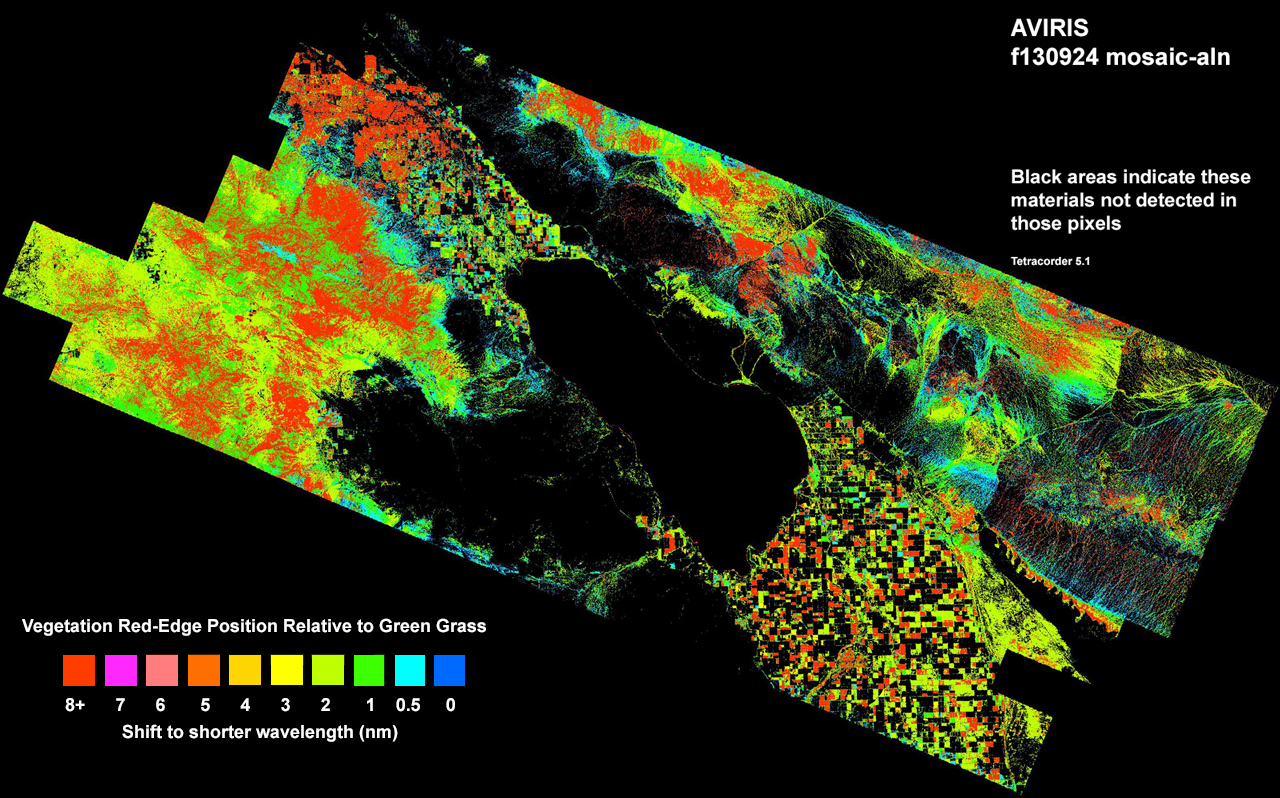
Figure 4. Tetracorder map of the red-edge position of the chlorophyll
absorption band in vegetation. This is a reduced version of full
resolution standard Tetracorder product.
All signatures should be checked for accuracy as calibration can throw off
identifications, and check that the Tetracorder expert system adequately covered
the environment.
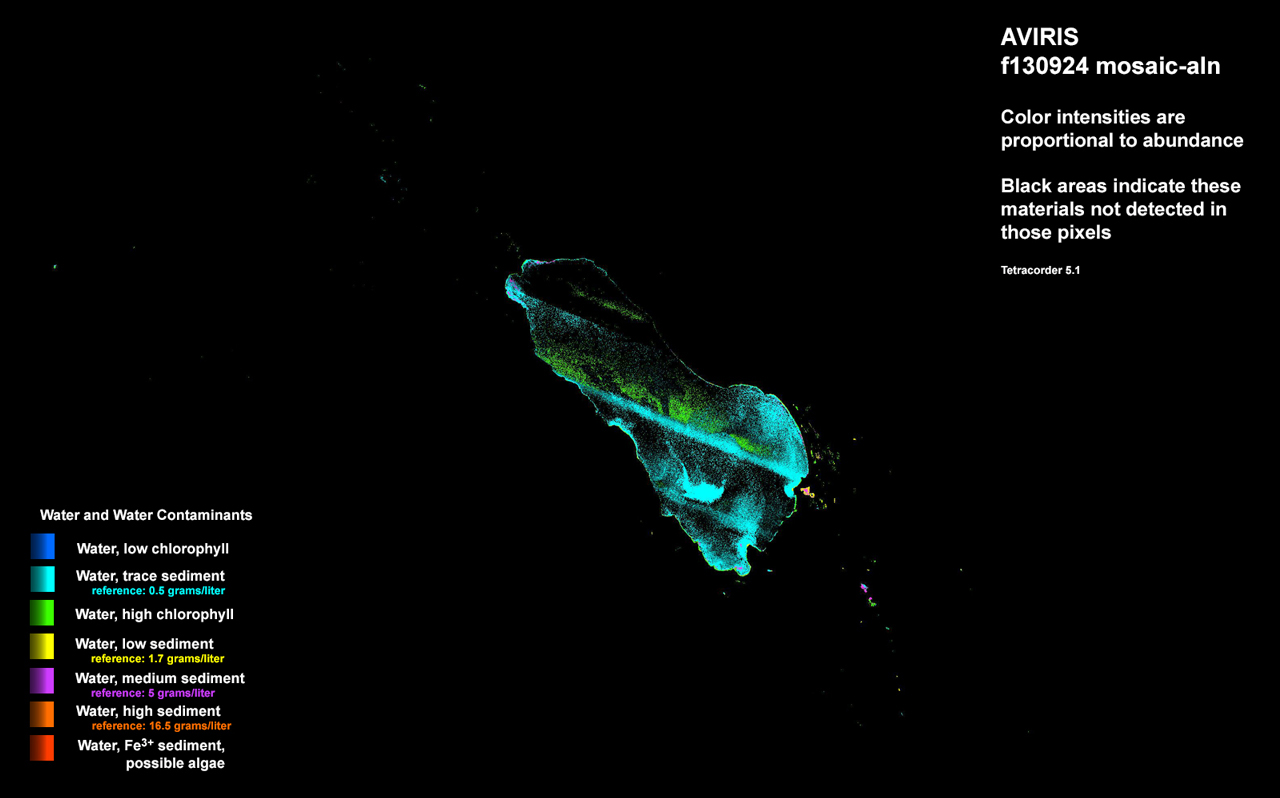
Figure 5. Tetracorder map of chlorophyll content in the lake. Note,
no masking has been done to separate the lake from land. Tetracorder
determined what areas are water solely by spectral content. Note,
the striping is caused by offsets in the calibration of the data due to
path radiance. This is a reduced version of full resolution standard
Tetracorder product.
All signatures should be checked for accuracy as calibration can throw off
identifications, and check that the Tetracorder expert system adequately covered
the environment.
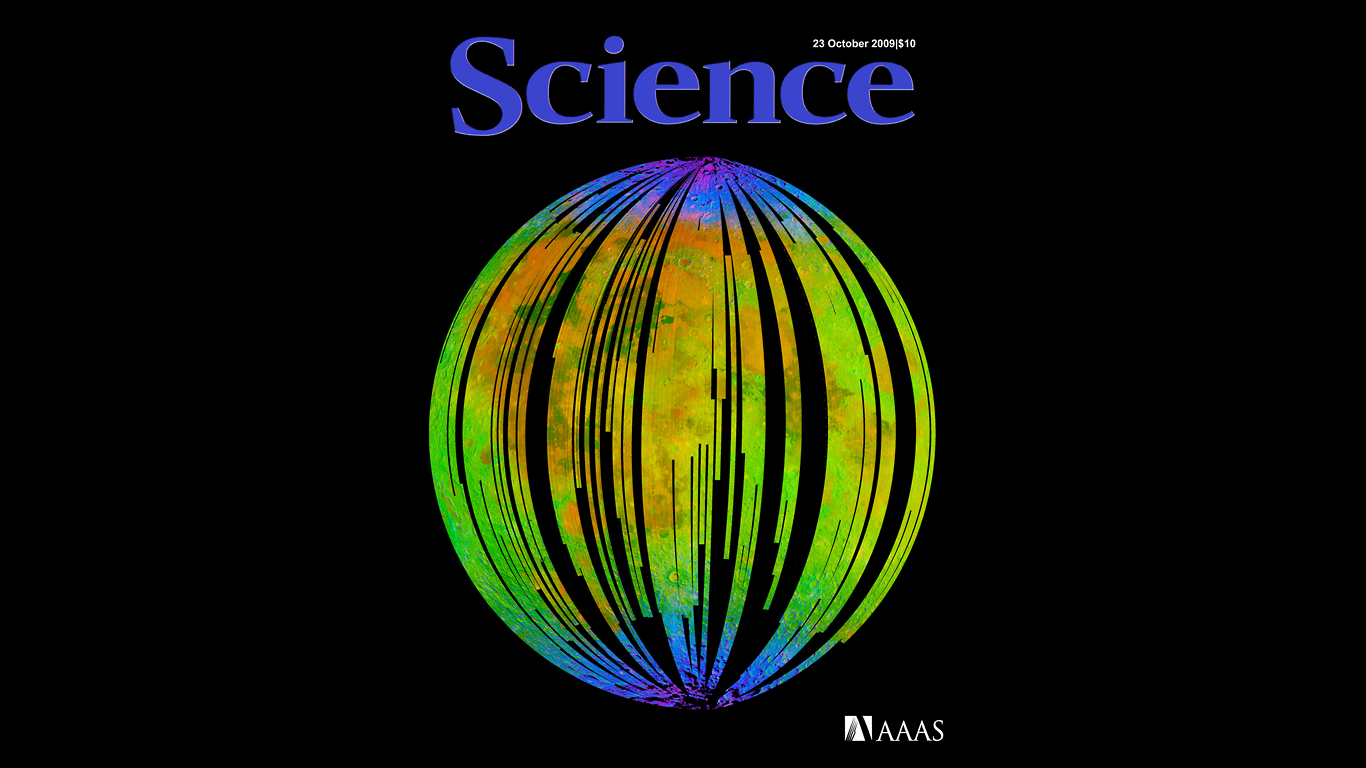
Figure 6. The Cover of Science for October, 2010 shows the discovery
of water in the Moon's polar regions (blue in the image) using the Moon
Mineralogy Mapper on Chandryaan-1. Tetracorder was key in making this
discovery and mapping water and hydroxyl on the Moon.
All signatures should be checked for accuracy as calibration can throw off
identifications, and check that the Tetracorder expert system adequately covered
the environment.
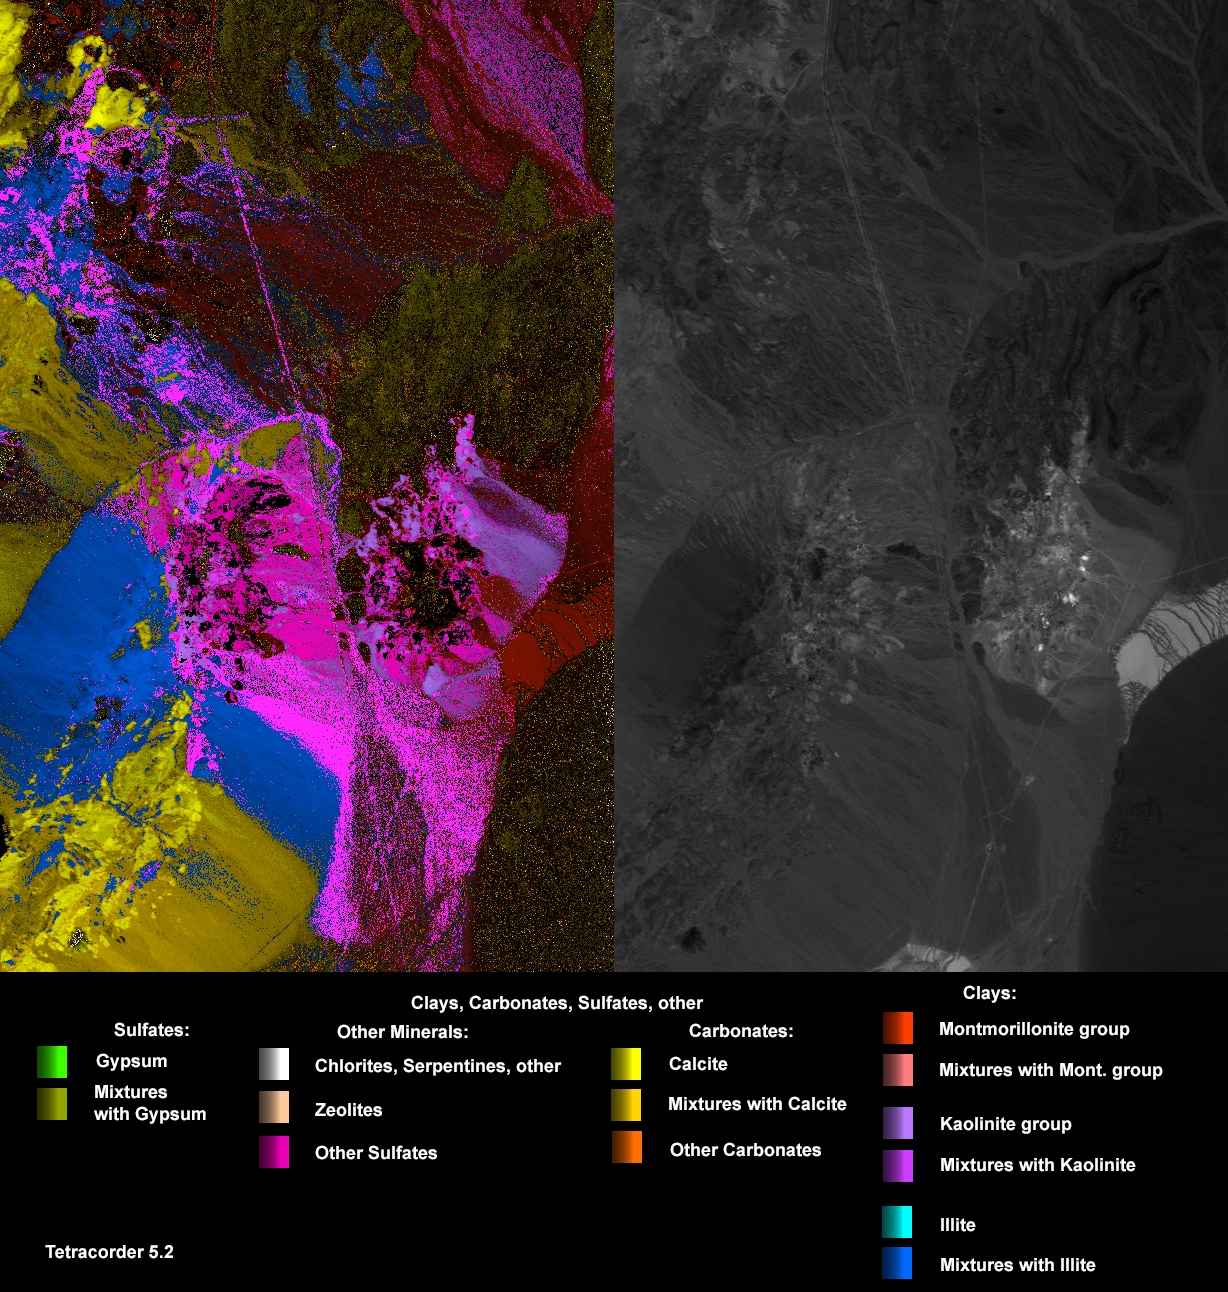
Figure 7. Tetracorder map of clays, carbonates sulfates and other
minerals using absorption bands in the 1.5 - 2.5 micron region (15,000 -
25,000 nanometers) for the hydrothermal systems at Cuprite, Nevada, USA.
The data were obtained by a NASA ER-2 aircraft (Extended Range U2) with
about 17 meters/pixel. Image width is about 10 km. This is a full
resolution standard Tetracorder product.
All signatures should be checked for accuracy as calibration can throw off
identifications, and check that the Tetracorder expert system adequately covered
the environment.
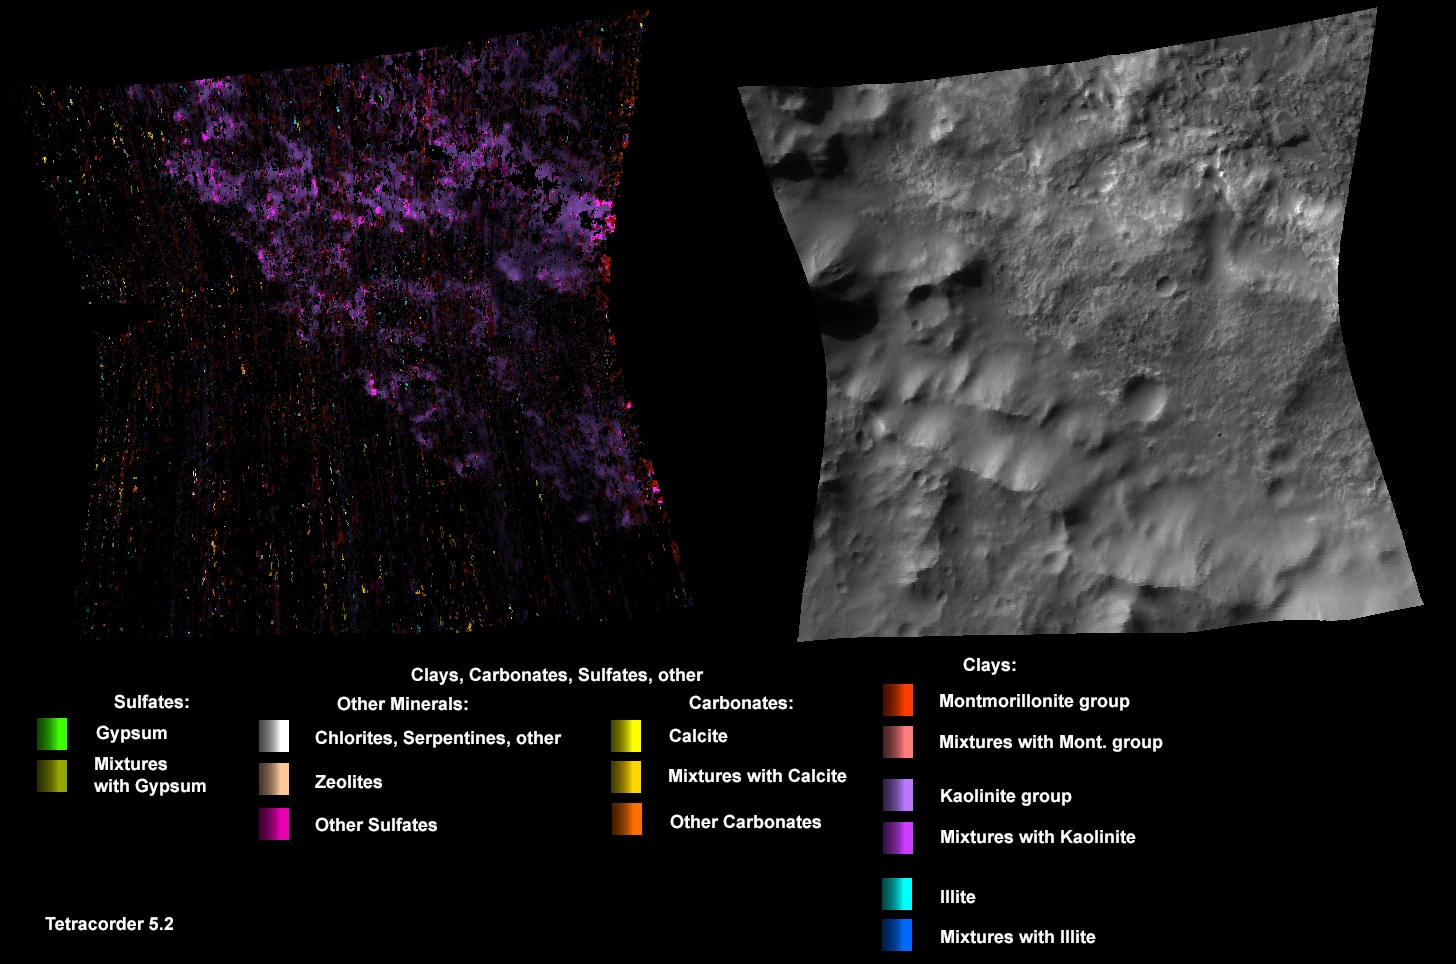
Figure 8. Tetracorder map of clays, carbonates sulfates and other minerals
using absorption bands in the 1.5 - 2.5 micron region (15,000 - 25,000
nanometers) for a hydrothermal systems on Mars. Note the same minerals
and colors as in Figure 7 and the intensities are calibrated to the
same levels. The intensities show that this hydrothermal area on Mars
has some of the same minerals (kaolinite group minerals and sulfates),
but weaker signatures than at Cuprite, Nevada. The data were obtained
by the Compact Reconnaissance Imaging Spectrometer for Mars (CRISM) on
the Mars Reconnaissance Orbiter. Image resolution is up to 30 meters/pixel.
This is a full resolution standard Tetracorder product and used the same
Tetracorder expert system that was used to map the Cuprite, Nevada area
shown in Figure 7.
All signatures should be checked for accuracy as calibration can throw off
identifications, and check that the Tetracorder expert system adequately covered
the environment.
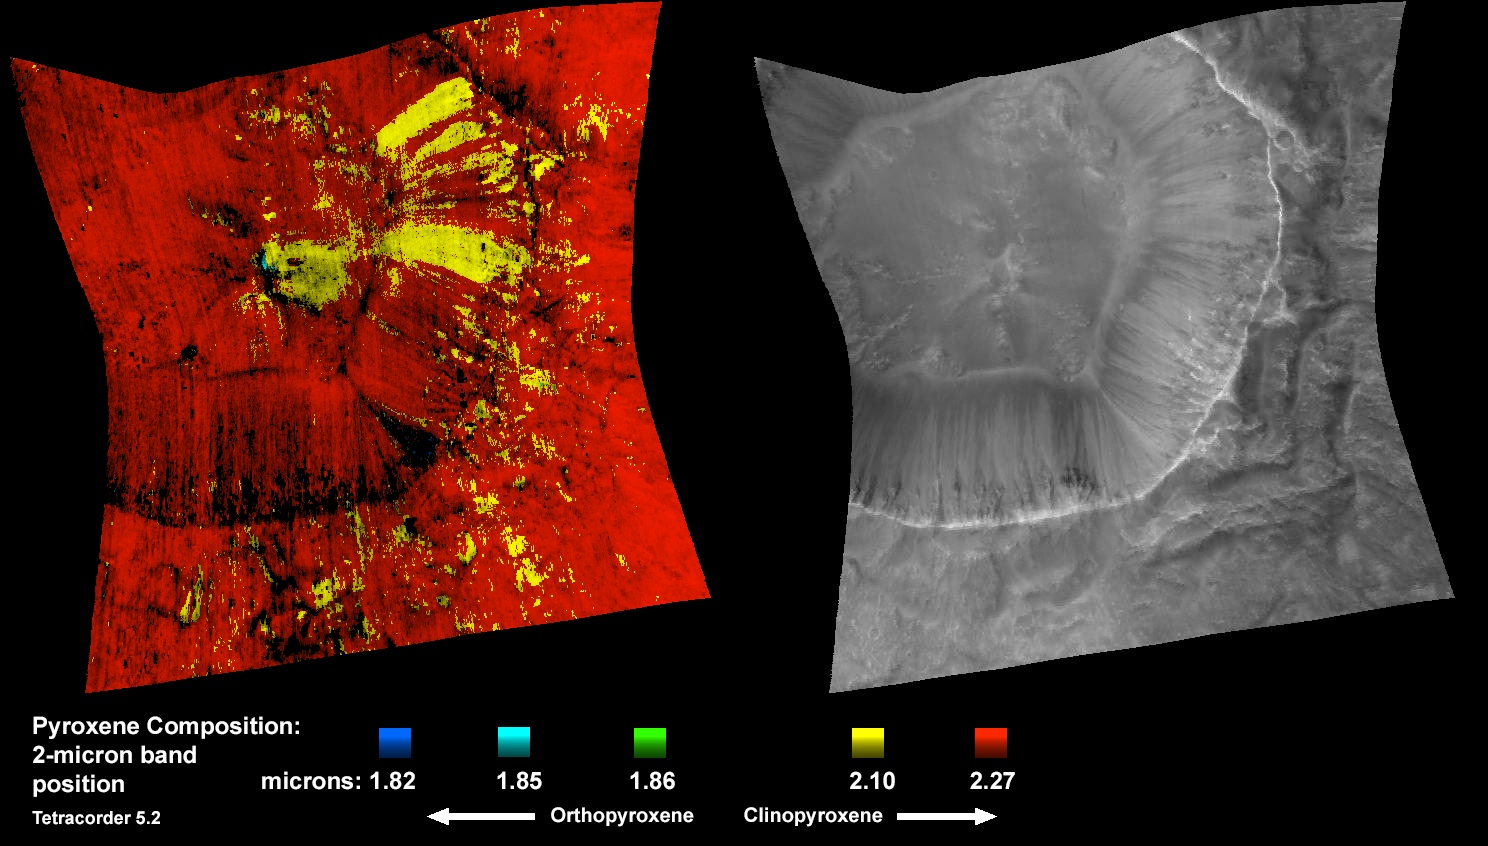
Figure 9. Tetracorder map of pyroxene composition using absorption in
the 1.8 - 2.3 micron region (18,000 - 23,000 nanometers) for a crater on Mars.
The data were obtained by the
Compact Reconnaissance Imaging Spectrometer for Mars (CRISM) on
the Mars Reconnaissance Orbiter. Image resolution is up to 30 meters/pixel.
This is a full resolution standard Tetracorder product.
All signatures should be checked for accuracy as calibration can throw off
identifications, and check that the Tetracorder expert system adequately covered
the environment.
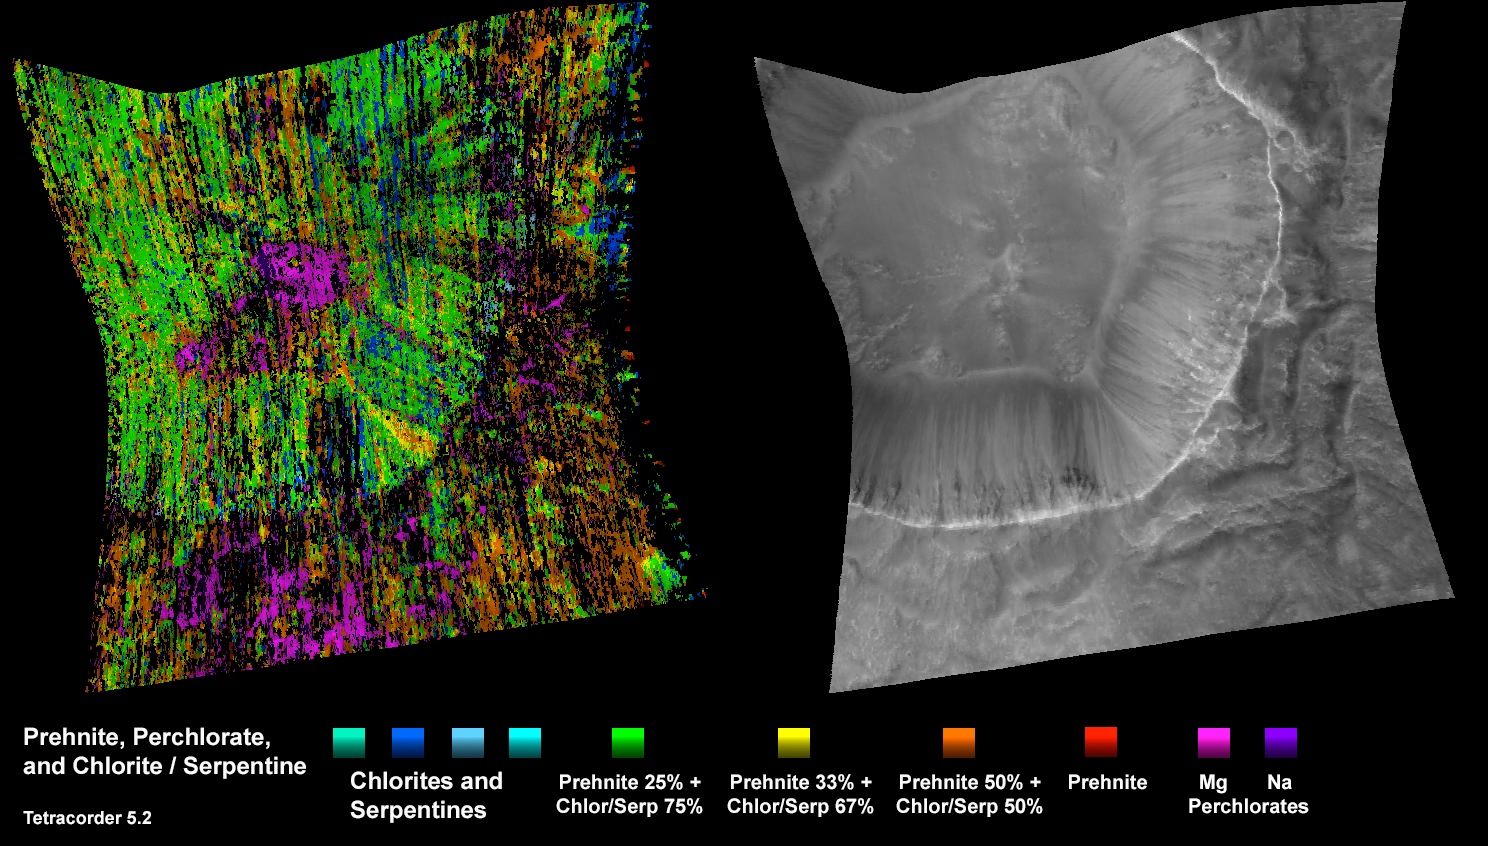
Figure 10. Tetracorder map of chlorites, serpentine, prehnite, and mixtures
using absorptions in the 1.5 - 2.5 micron region (15,000 - 25,000 nanometers)
for a crater on Mars.
The data were obtained by the
Compact Reconnaissance Imaging Spectrometer for Mars (CRISM) on
the Mars Reconnaissance Orbiter. Image resolution is up to 30 meters/pixel.
This is a full resolution standard Tetracorder product.
All signatures should be checked for accuracy as calibration can throw off
identifications, and check that the Tetracorder expert system adequately covered
the environment.
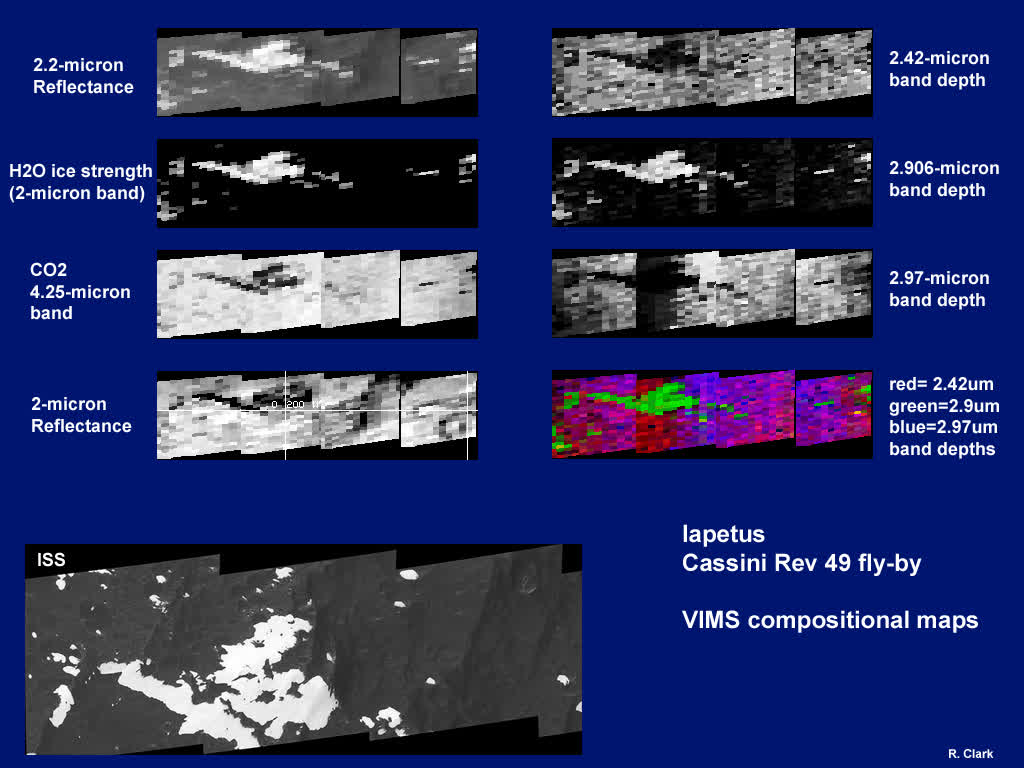
Figure 11. Reflectance and Tetracorder maps of absorption features in
spectra of the dark side of Saturn's moon Iapetus. Data are from the
Visible and Infrared Mapping Spectrometer (VIMS) on the Cassini orbiter.
The position indicated by the vertical line in the 2-micron reflectance
image is 200 degrees west longitude, and the horizontal line is the equator.
A custom Tetracorder expert system was used for this mapping.
The absorption at 2.97 microns is suspected ammonia. The 2.42-micron
absorption is trapped hydrogen, H2. From Clark et al., 2012,
The surface composition of Iapetus: Mapping results from Cassini VIMS,
Icarus, volume 219, p. 831.
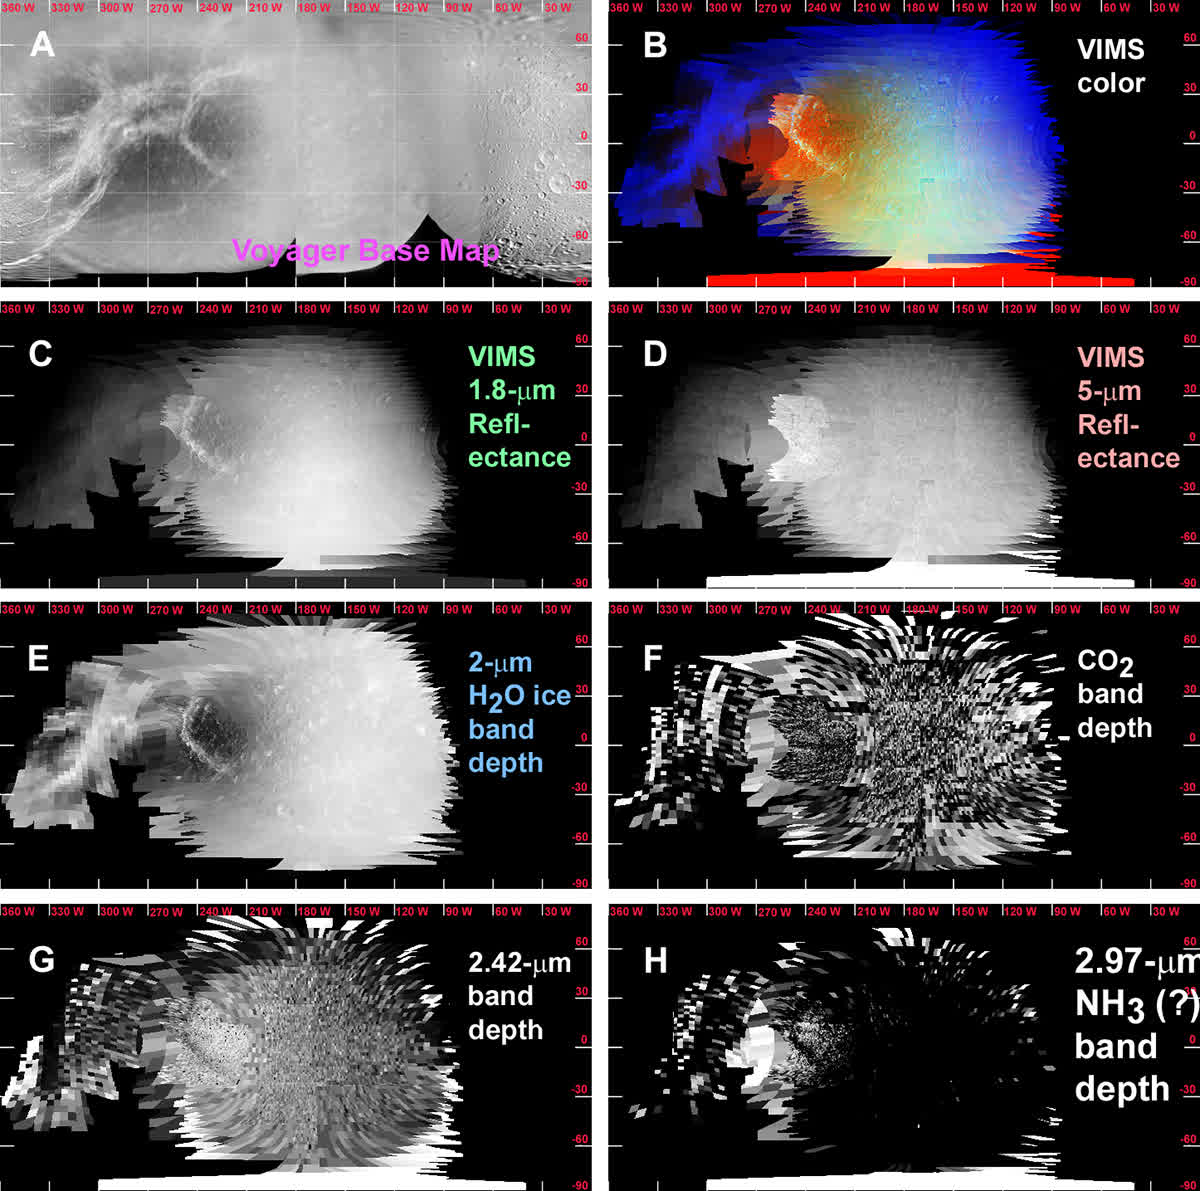
Figure 12. Reflectance and Tetracorder maps of absorption features in
spectra of Saturn's moon Dione. Data are from the Visible and Infrared
Mapping Spectrometer (VIMS) on the Cassini orbiter. The color image in
panel B is a false color IR image using the data shown in panels D (red),
C (green) and E (blue). The 2.42-micron absorption is trapped hydrogen,
H2. The absorption at 2.97 microns is suspected ammonia.
A custom Tetracorder expert system was used for this mapping.
From Clark et al., 2008, Compositional mapping of Saturn's satellite
Dione with Cassini VIMS and implications of dark material in the Saturn
system, Icarus, volume 193, p. 372.
This page URL: http://www.clarkvision.com/science
| Home | Galleries | Articles | Reviews | Best Gear | Science | New | About | Contact |
First Published February 1, 2017.
Last updated March 30, 2023