How to Interpret Digital Camera Sensor Reviews:
Sensor Noise, Thermal Noise, Dynamic Range, and Full Well Analysis
by Roger N. Clark
All images, text and data on this site are
copyrighted.
They may not be used except by written permission from Roger N. Clark.
All rights reserved.
Contents
Introduction
The Noise Floor, Dynamic Range and Pattern Noise
Sensitivity and ISO
Overview Assessment of Clarkvision Sensor Reviews:
What Photographers Should Look for First in Review Data after Reading the
Above information
How to Compare Cameras
Derived Sensor Parameters
Dark Current
Conclusions
Other Recommended Review Sites
References
Introduction
Reviews on digital cameras here on Clarkvision.com are among the most
technical you will find on the internet. If you are not familiar with
the technical terms, I'll describe them here and what they mean to you
in your photography. Photography is all about the light: collect as
much light as one can to record the scene.
Light is made up of energy "packets" called photons. Our eyes collect
photons enabling us to see. A camera also collects photons to record
an image. During the day, we are bathed in millions and billions of
these tiny photons. They give us warmth and enable us to see as light
bounces off different objects. At night there are many fewer photons for
us to see: light from stars, the Moon and others things in the night sky,
or nearby man-made lights. But light is finite. That is actually good,
because if there were a lot more light, we would all burn up from all
the energy in those photons.
Photons have an interesting property that enables us to measure specific
properties of a camera's sensor. Because photons are coming from many
sources, whether the center or edge of the solar disk (remember the sun
is many times larger than the Earth), during the day, or stars at night,
photons arrive randomly, meaning they are not in sync. This randomness
has an interesting property: if we collect these randomly arriving
photons for a given time interval, say one second, we can measure how
many photons we collected, and if we do that again for another second,
we can measure how many we collected, but it will likely be different
than the first measurement. This means we don't really know the true
average because it is always fluctuating. This results in noise in
our measurement and is the main noise source we see in our digital
camera images. Each pixel is a measurement of a number of photons.
But even if we imaged a perfectly uniformly lit surface, we would see
noise in our images. The amount of noise is given by mathematics and is
called Poisson counting statistics. The noise is the square root of the
number of photons collected. For example, if a camera had 100 photons
on average collected by each pixel, the noise would be square root 100,
or 10 photons. We would then say the signal (100) to noise (10) ratio
is 100/10 or S/N = 10. But from one pixel to the next, the signal in
each pixel would vary by something more than 10 (the noise is a standard
deviation, so the noise in one pixel could be more than 10 different
from 100, but usually it would be less than 10 different from 100).
Because our sensors can never collect an infinite number of photons,
there will be noise in the images. Even if sensors were
perfect they still can't collect an infinite number
of photons, so images will always contain noise, sometimes quite significant
noise when light levels are low, or exposure times short.
It is the noise = square root of signal property of light that enables us to
characterize sensors. It provides a unique signature that enables us
to determine photon counts, and that then enables us to determine
characteristics of the sensor, including how efficient it is. The results
that I derive in my senaor reviews are on an absolute level such that
different cameras can be more fairly compared. The manufacturers of
sensors do very similar testing to what I show here in my sensor analyses,
but they typically do not tell the consumers what the results are.
If you find the information on this site useful and wish to purchase the equipment
that I use to make images, please use
the links to B&H Photo to make the purchases. By using the link, you will help support
clarkvision.com at no additional cost to you. I have used B&H Photo for decades and
have always had a great experience and their prices are very good.
Please support Clarkvision; make a donation (link below).
The challenge for the photographer is to collect enough light to make a
quality image, usually in a short enough period before the subject moves.
For relatively simple subjects in good light, many cameras will do a great
job on many subjects. But as conditions get difficult, for example with
low light levels, such as a limited exposure to freeze action on wildlife
at sunset, then the amount of light one collects to make the image
becomes more difficult and the lens and sensor together are important.
The lens is BY FAR THE MORE IMPORTANT FACTOR
in collecting light. There are amazing arguments on the internet about
cameras and sensors, and they mean little without the lens. It is the lens
that collects the light. Given a camera with a poor sensor, and a great lens,
versus a great sensor and poor lens, I'll take the system with the better
lens. But when you really need to push limits, a great lens and a
great sensor working together can make amazing images that would be very
difficult to obtain with lesser equipment.
For example, by reading my sensor reviews here you will see the Canon 5D Mark
II has pretty bad banding problems: vertical and horizontal striping
in dark areas of an image (Figure 1). By reading
the disparaging remarks
on the internet, or the low numerical scores given by review sites like
DXO Mark, one would think the camera was incapable of making great images.
Not so. Certainly the banding problem will limit results in more extreme
cases, but the camera is still capable of making great images in good
light, for example, Figure 2. Knowing the sensor's limitations, one could compensate
and still make great images in difficult/low light as shown in Figure 3.
The information in the Clarkvision reviews and articles provides the information you need
to use a camera with the best settings in difficult situations like low light.
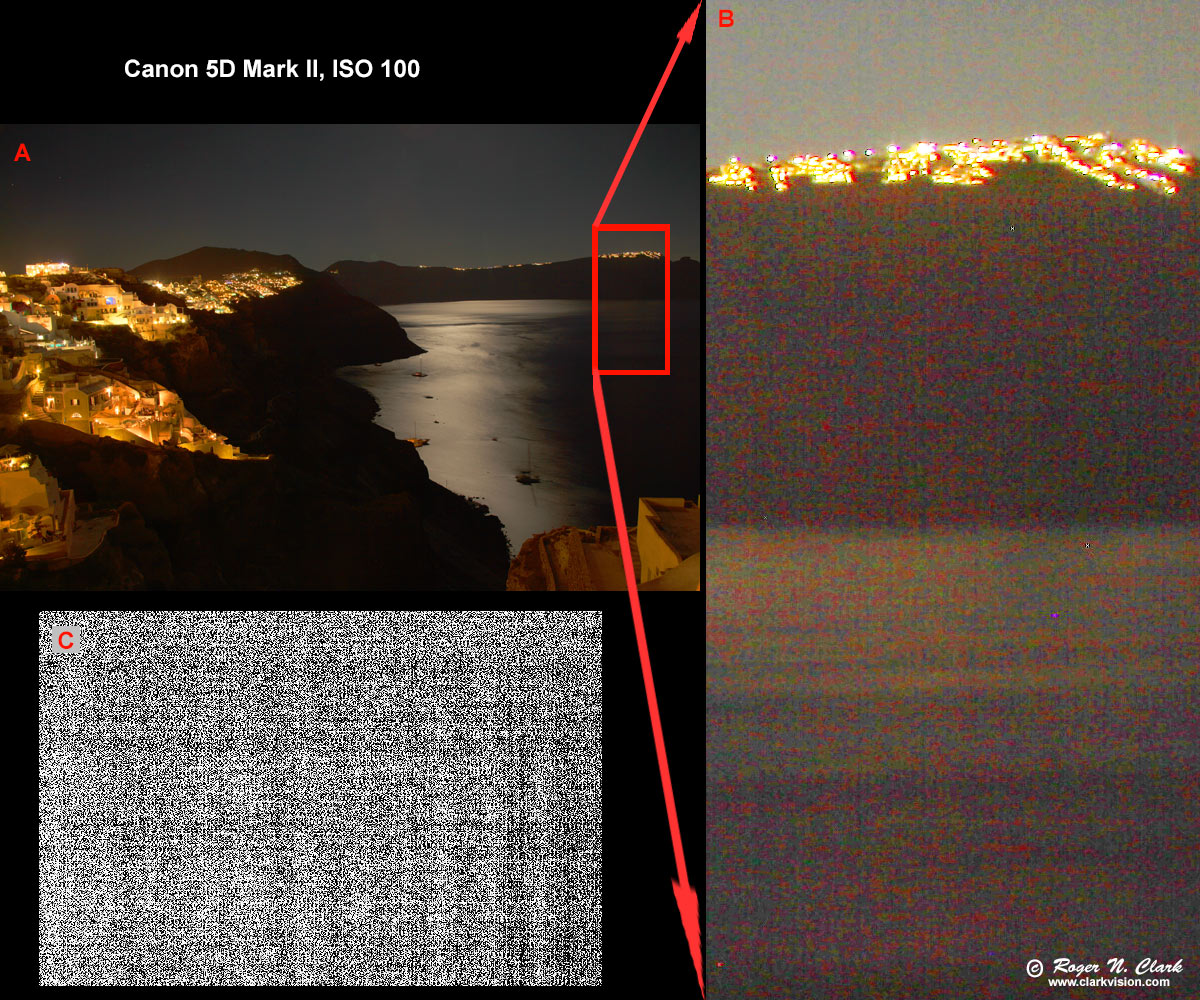
Figure 1. A) A night image of the Santorini caldera made with a Canon 5D Mark II
at ISO 100. The pattern noise from the sensor results in horizontal and
vertical striping in darker parts of the image, enlarged and brightened
in panel B to show the effect. Panel C shows an image of the banding problem from
the Clarkvision sensor review of the 5D Mark II.
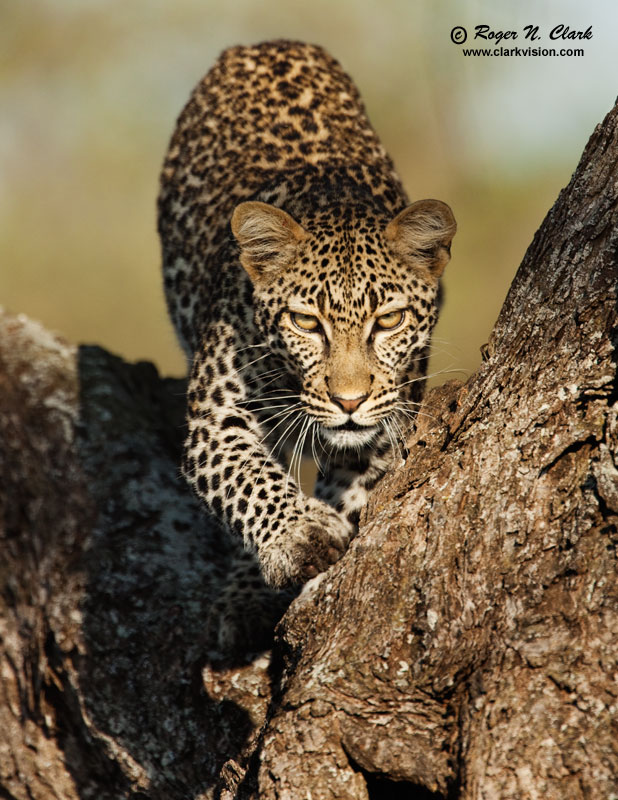
Figure 2. Approaching leopard, made on the Serengeti with a Canon 5D Mark II
digital camera and 500 mm L IS lens with a 1.4x teleconverter.
Good photographers can make great images with many cameras. But gear does matter
in some cases. See my
"Does Gear Matter in Photography?" article for more on this subject.
When you want to push limits, whether fast action or low light photography,
knowing the equipment and its weaknesses can make a difference. For example,
in the above Santorini night image (Figure 1), I could have made a better
image by choosing a different ISO and exposing differently. Thus, knowing the
camera's capabilities and weaknesses allows one to choose the best settings
for a particular image. Knowing the sensor characteristics when purchasing
a camera allows one to choose the best camera for the job. After viewing
Figure 1 and the banding problems of the Canon 5D Mark II, one might conclude
a good low light image is not to be from this camera. However, that is not the case.
The nightscape image in Figure 3 illustrates the Canon 5D Mark II can make
great low light images. The reviews here will show which ISOs work
best for these extreme cases.
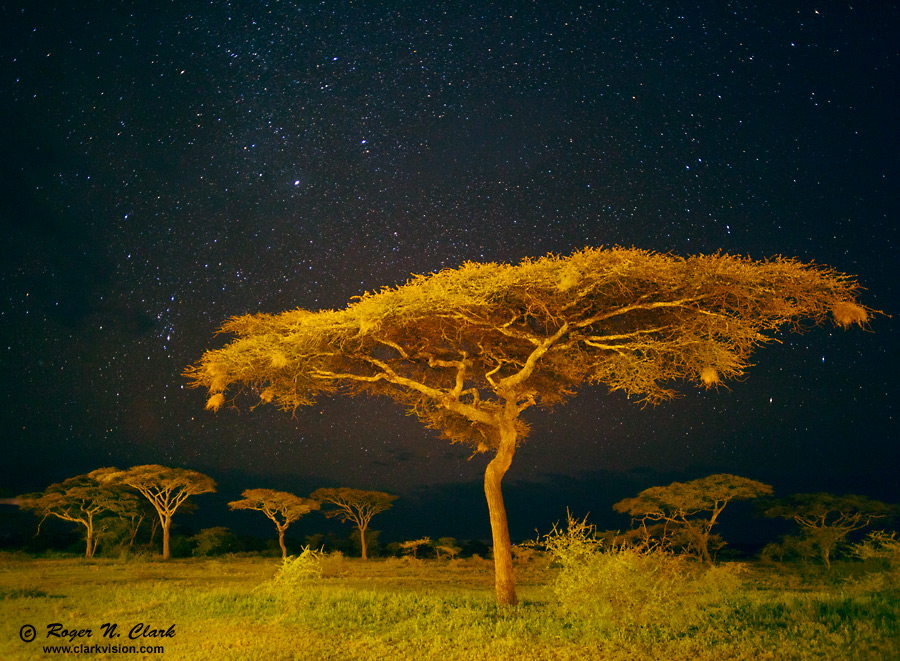
Figure 3. Stars Over the Serengeti. Canon EOS 5D Mark II 21 megapixel
camera, 20 mm f/2.8 lens, 30 second exposure on tripod at f/2.8, ISO 3200.
This image illustrates that the Canon 5D Mark II is capable of making good
low light images. See below for why and how.
The Noise Floor, Dynamic Range and Pattern Noise
What are we seeing in new generations of cameras that make them better?
The main improvements in digital camera sensor performance, besides increasing megapixels, have been at the
low end of the intensity range. Early digital cameras did not digitize the range very well
(e.g. older cameras used 12-bit analog-to-digital, A/D, converters), and had a lot of
striping and other patterns in the low level signals. Each generation of cameras has
usually improved the low end. A better low end means one can record lower light levels better,
and/or lift shadows more to record and display a greater dynamic range
without annoying visual artifacts like banding.
The human eye+brain can distinguish about 14 stops of dynamic range in one scene, thus reaching this level
is desirable in order to make images similar to what can be seen with the human eye.
But this need not be on a pixel level, as groups of pixels averaged together can achieve
that range in today's cameras under many conditions.
So what is important in the reviews on this site? And conversely, what is not important and what
to ignore? The discussion here also has implications for what is important in reviews on other sites.
One certainly desires noise to be low.
But more important than random noise is pattern noise. These are patterns that
correlate over a group of pixels, usually along a line or column, but can vary
from frame to frame so there is no way to cancel them out. This effect
is called banding noise, and fixed pattern noise (really pseudo-fixed pattern noise).
All cameras I have tested show pattern noise at some levels. Pattern noise is
perceptually quite annoying and is hard to quantify. For this reason,
I show images of noise. You can evaluate the noise patterns and determine
with some experience and your style of imaging, what will be important in your
photography.
The noise reported in clarkvision reviews is referenced to the SUBJECT. Noise is given
in electrons, which means photons (light) from the subject. This is important, because if
a review does not reference signal and noise to the subject, then comparisons between cameras
can lead to incorrect conclusions as to which is best. Indeed, I see many reviews
which vary the light levels per pixel by changing lens apertures leading to bias
and erroneous conclusions between cameras on noise and image quality.
Figure 4 shows example noise patterns in the 5D Mark II camera at 3 ISOs.
The peak to peak banding intensities are actually smaller than the
measured random noise. The patterns we see illustrate how well the
human visual system can pick out these patterns embedded in random noise.
But that makes it a challenge for the camera manufacturers to produce
cameras with low banding problems. Look at the level in the Figure:
only 40 electrons total range and the patterns are at a level of just
a few electrons. This is simply astounding to achieve such uniformity
yet consumers consider this camera to be poor because of this issue.
The random noise is called the apparent read noise. At the higher ISOs,
the read noise is dominated by noise from reading the signal off the
sensor. At lower ISOs, camera electronics add to the sensor read noise.
There is a lot of discussion on the internet about which cameras have
lower read noise. But pattern noise is more objectionable than read
noise, and in my experience the more limiting factor in producing quality
images that push limits. In my reviews, I will show the banding problems
on absolute levels so different cameras can be compared on an equal basis.
The images in Figure 4 illustrate another property: our eyes are attracted to the brighter
things in the scene. Each image has the same average intensity as the ideal panel in
Figure 4. But brighter pixels draw our attention and the image appears brighter than average.
Perceptually, the brighter lines appear more objectionable.
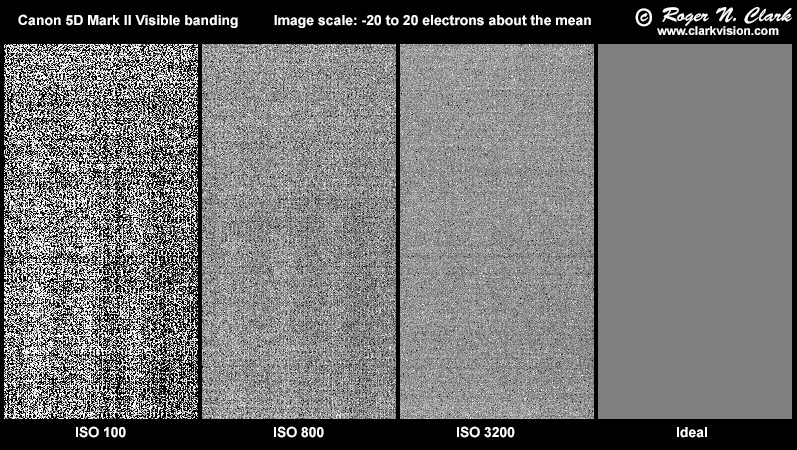
Figure 4. Pattern noise in the Canon 5D Mark II at 3 ISOs. On the right is the ideal
response. The intensity scale is -20 electrons (black) to + 20 electrons (white).
The 5DII shows varying spatial frequencies of patterns, generally decreasing with
higher ISOs. This indicates that the source of the patterns are after the sensor
and in the downstream electronics. At ISO 3200 the patterns are much smaller in intensity
than the random noise (in this case, mostly read noise from the sensor) but still
visually objectionable. The pattern noise limits the ability to pull out faint
detail in an image, because it is perceptually objectionable.
The Canon 6D low level noise is shown in Figure 5. Very little pattern noise is
obvious. Note that the noise is higher as low ISO than at high ISO. This means
that smaller signals will be better detected at the high ISO setting. When choosing a camera
compare the sensor reviews
for each camera and examine the pattern noise for each camera around similar ISOs
(more on what ISO means below) to see which will perform better, and which might suffer from
pattern noise. This is illustrated in Figure 6 for ISO 1600 with 5 Canon cameras.
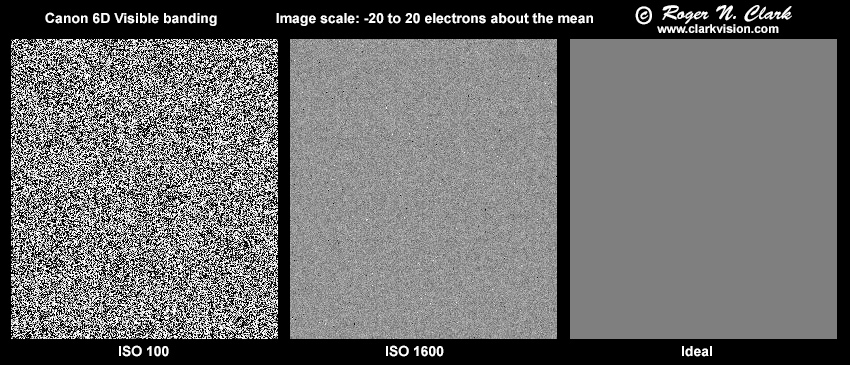
Figure 5. The apparent read noise for the Canon 6D at ISO 100 and 1600.
The lower noise in electrons means better detection of low light levels,
whether details in shadows in a daytime image, or faint signals in a night image.
The 6D shows virtually no pattern noise at either ISO at this scale.
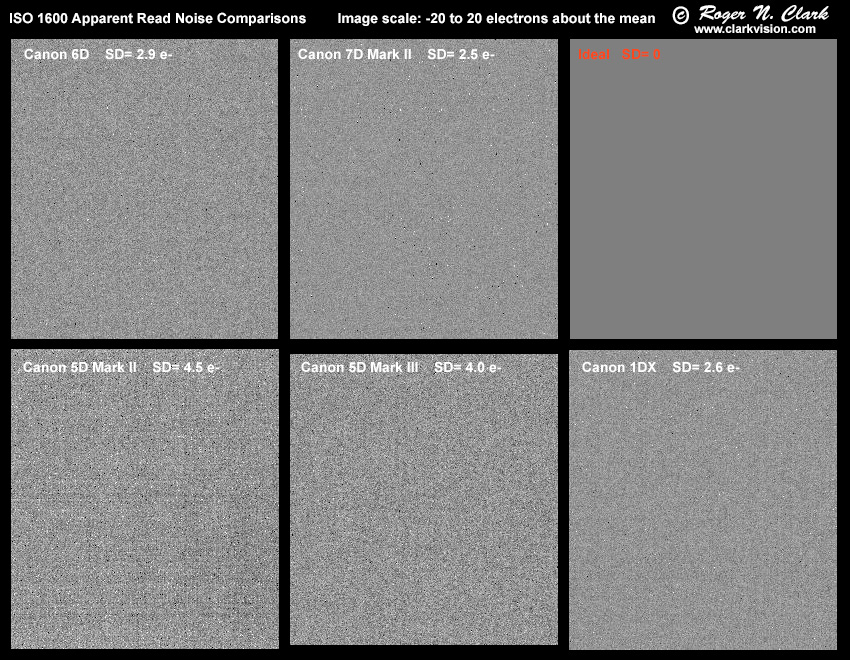
Figure 6. Noise at ISO 1600 for 5 cameras is compared. SD means Standard
deviation, a measure of the amount of noise; a larger value is worse. Pattern noise from
worst to best are: 5D Mark II, 5D Mark III, 1DX, 6D and 7D Mark II.
When pattern noise is as low as in the 6D and 7D Mark II, read noise
is the limiting factor when other noise sources are smaller. Conditions where
read noise is not a limiting factor include the following. In night sky
photography, photon noise from the sky usually dominates over read noise.
In long exposures, noise from dark current is usually greater than
read noise unless it is very cold. Conditions where read noise can dominate
over photon noise in our images includes short exposures (less than a few seconds)
in scenes that include deep shadows where the camera receives almost no light.
Some cameras trick us from seeing low level noise by truncating the low end.
Figure 7 shows an example of the Nikon D800e noise. The Nikon raw data are clipped
and at low ISOs, some 86% of the pixels are zero. If there were pattern noise
in the image, it would be hard to see. Indeed it is there faintly in the remaining
data (also see the patterns in the red pixels in panel B of Figure 7).

Figure 7. Noise at ISO 100 from a Nikon D800e. Panel A show the noise. Faint
horizontal banding is apparent even though 86% of the pixels are clipped to zero.
Panel B turns all zero pixels from panel A red. Note both horizontal and
vertical banding appears in the red pixels. The ideal panel shows what
we would want the image to look like. Also note the small red squares
in panel B (just below center near the left edge, another at the right
edge, above center, and at the bottom edge, near center). These are
strange zones where a block of pixels have been truncated.
Clipping of the raw data will skew measurements of the read noise and
dynamic range if the clipping is not accounted for properly. In the case
of the Nikon D800 at ISO 100, the clipping of data reduced the measured
read noise by almost a factor of 4 (2 stops) and that made a corresponding
increase in dynamic range of 2 stops if clipping is not accounted for.
Reviews that do not account for this will derive parameters and scores
that make the camera look much better than it really is. Perceptually,
the clipping the way Nikon implements it still produces amazing images
and in many photographic situations, photographers will not be hampered by
this clipping issue. But clipping could limit detection of faint signals
if images that have clipped lows were co-added (which is commonly done
in astrophotography), because averaging clipped data still results in
clipped data. It is important to know if the camera you might purchase
might limit your intended photographic applications because of clipped data,
or if you have the camera, how you might work around such a problem.
Canon raw data can be processed similarly to Nikon data, only done as a post processing
step with more control. An example is shown in Figure 8. The same raw data from the Canon
6D in Figure 6 was processed by clipping the low end like the Nikon data in Figure 7.
The results in Figure 8 show remarkably similar noise patterns. The clipped "read"
noise decreased by a factor of 2 and the "dynamic range" increased by a factor
of 2 (1 stop). With clipping influencing some derived statistics, which camera really has better
dynamic range? The clarkvision reviews will work to compensate for clipped data
to tell the real story of camera performance. Also see this article on how to
process canon raw data:
Processing Canon Raw Image Data to Maximize Dynamic Range.
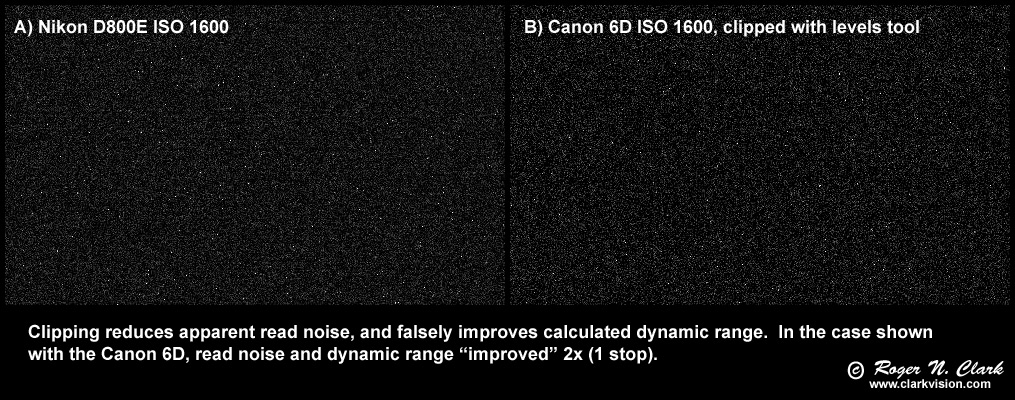
Figure 8. Comparison of clipped raw data from a Nikon D800e with post processing clipping
of Canon 6D raw data to show similar results can be obtained.
Sensitivity and ISO
First, some notes about sensitivity. On the internet one reads a lot about
different sensors and their sensitivities, or boosting sensitivity with ISO.
ISO does not change sensitivity. ISO is a post sensor gain. Increasing ISO
simply amplifies the already recorded signals from the sensor to a greater degree. If you remember
digital zoom, the digital enlargement of an image post sensor that isn't
real zoom, well, ISO is like digital sensitivity: amplification of the signal
from the sensor is actually post sensor (in many cameras this amplification is a combination
of analog and digital). ISO does not change the amount of light gathered;
only lens collecting area (e.g. changing the f/ratio on a lens) and exposure time does that.
The second important note about sensitivity of today's digital cameras is that
actual sensitivity has changed only by about a factor of 2 over the last decade
and a half from the earliest models to the most recent. The system sensitivity of a digital camera includes the transmission
factors of the red, green, blue, and IR filters over the detector, the efficiency of the micro lenses
over the pixels, the fill factor (the actual sensitive area of the pixels),
and the quantum efficiency of the actual sensor. Most of the early improvements
were in the fill factor and improving the micro lenses. For the last half decade
or so, sensor system efficiencies have changed very little, only increasing by about 20 to 30%.
Silicon photo diodes have an efficiency (the photon conversion rate, or Quantum Efficiency, QE) of around 90%.
Even the
first digital camera in 1971 had a QE of about 90%. The support electronics in
modern CCD and CMOS sensors block and absorb some light, lowering efficiencies.
The point is that current digital cameras from all manufacturers have
pretty decent quantum efficiencies that do not vary much between models.
The technology for the QE is pretty mature. It's the low end where we have seen
the most improvements over the years. The noise at the low end is getting pushed lower and
lower, enabling us to record decent images with smaller amounts of light.
The main factor that people see and argue about on the internet regarding sensitivity
is pixel collection area. A lens of a given f/ratio will deliver X photons per
square micron to the lens focal plane where the sensor is located. Thus a larger
pixel, covering more square microns, collects more light per pixel. But say one
had a camera (Camera B) with pixels that are half linear size of the pixels in camera A.
Thus, 4 pixels in camera B cover the same area as one pixel in camera A and would collect
the same amount of light if made with the same quantum efficiency. And that is exactly what we see today
with a wide range of cameras having different pixel sizes, all made out of
silicon with the same basic Quantum Efficiency (the same basic sensitivity
to light).
A lot of internet discussions are irrelevant regarding actual camera performance.
It is generally assumed on the internet that
larger pixels collect more light and that cameras with larger pixels have greater low light
sensitivity. The derived parameters like maximum signal per pixel (also called full well capacity)
as given in Table 1 when compared between cameras do show that larger pixels hold more light
(electrons). But that is like saying my bucket has more water in it because it is a 5-gallon bucket
and you only have a one gallon bucket. But did I actually put any water in the bucket?
In one recent argument, an internet poster said put out a thimble next to a swimming pool
and see which one collects more rain drops. Well, that is obvious but the analogy to
light and cameras is lacking one thing: a lens, or in the case of rain drops,
a funnel. The rain drop analogy is good because like raindrops, light is composed
of photons (particles of light) that randomly arrive at our eyes and camera lens.
To illustrate this concept, consider the graphic in Figure 9. The photon rain analogy can
be considered raindrops on a rainy day, or photons coming to our camera. The
orange lines represent funnels in the rain, or a lens focusing light onto a pixel
in a camera. Two different cameras are illustrated, one having large pixels and
one having pixels half the size. The lens collects the light and as long as
the lens diameters are the same. This results in equal performance as long as the pixel
does not overflow (see Figure 9 caption).
The amount of rain (photons) in each bucket (pixel) is the same.
Figure 9. Raindrops (blue) as an analogy to photons entering a camera. The buckets ("pixels")
fill with water (blue), but the orange funnels collect the rain and focus it
onto the buckets (pixels). In this case the large end of the funnels have the
same diameter so collect the same amount of rain per unit time (the exposure).
The ONLY difference is the small bucket will fill up faster, but that is not
a problem in low light situations. Small buckets are NOT a disadvantage.
The funnel diameter controls how much rain goes into the bucket,
not the size of the bucket. It is the same with cameras, lenses, and pixels.
The angle "a" is the is the angular size of a pixel and is the same for
both the large and small pixel in this example.
In a camera, both cameras would get the same amount
of light per pixel, show the same noise, have the same pixels on the subject, and
have the same depth of field.
A good illustration of the above concepts is detecting the faintest star
with different format cameras as shown in Figure 10. The Canon 6D has 6.58 micron
pixels (area= 43.3 square microns) and the 7D has 4.3 micron pixels
(area= 18.3 square microns). The area ratio is: 2.3, so the 6D collects 2.3 times more light
per pixel in the test that used the same lens with the same exposure time.
Clearly, 6D did not outperform the cameras with smaller pixels, but the
small pixel 7D and D800e cameras significantly outperformed the larger pixel
6D. Also, the 7D crop camera provided almost the same faintest star detection
as the full frame D800e, so sensor size is not a factor.
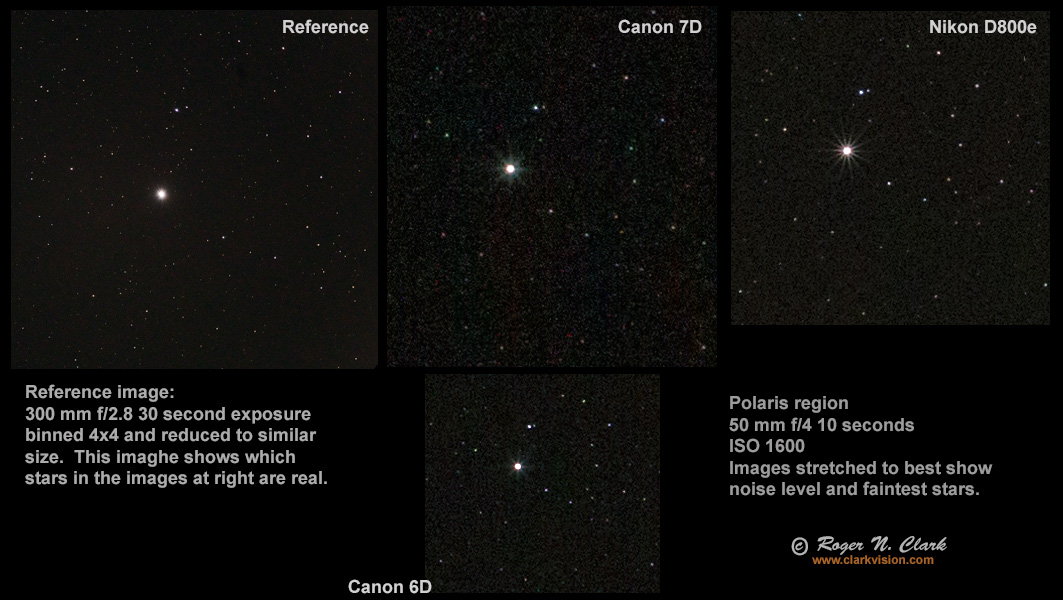
Figure 10. Comparison of faintest star in 3 cameras, each a 10-second
exposure at ISO 1600 with a 50 mm lens at f/4 (aperture diameter = 12.5 mm).
The Nikon D800e and Canon 7D (Mark 1) show about the same level, and both
show fainter stars than the Canon 6D which has larger pixels. All three
cameras have similar low read noise. See text as to why the 6D does not
detect as many faint stars. Note the Nikon D800e raw data are filtered in camera,
so appear with less noise.
The reason the smaller pixel cameras record fainter stars is that the signal
is a combination of light from the star plus light from the sky. The sky also contributes
noise (noise is the square root of the number of photons collected). Larger
pixels see more sky when using the same lens, so collect more light, thus
the noise added to the starlight is greater, making contrast between star and
sky lower with more noise.
All of the above point to some fundamentals when reading derived review
parameters on this site or other sites. Pixel size is irrelevant regarding sensitivity.
What people and some review sites are reporting when they show noise differences
between sensors is that they used lenses with different aperture diameters
so collected different amounts of light, and not actual sensor performance!
The lens is key.
Now I'll discuss the derived and presented sensor parameters and the implications
for photography.
Overview Assessment of Clarkvision Sensor Reviews:
What Photographers Should Look for First in Review Data after Reading the
Above information
There is a lot to digest here. For the average photographer trying to choose a camera
here is what to look for first.
In each review, examine the images in Tables 2a and 2b. Look for banding and other patterns
in the images presented (see discussion above). Choose a camera that has the least pattern issues.
If you already own the camera, use Tables 2a and 2b to see which ISOs to avoid if you want to dig
signals out of the shadows. For example, in many Canon cameras prior to the 6D and 7D2,
pattern (banding) noise was a problem for low light night photography at ISOs below
about 1600. The Canon 5DII was worse, with banding problems even at ISO 3200 (though
smaller at that point). On Canon cameras prior to the 6D and 7D2, I would use them
at ISO 1600 for night photography and for the 5DII i used it at ISO 3200.
Remember, high ISO does not cause noise; low light causes noise.
If I intended to use the camera for long exposure low light work, I would look at
the thermal noise images in Tables 4A and 4B to be sure they did not show pattern (banding)
problems. Then compare thermal noise at similar temperatures for each camera.
If you needed reach, smaller pixels give the same equivalent reach as an increase
in focal length. If you can keep the lens aperture diameter the same and the exposure
time the same, then you can maintain signal-to-noise ratio (S/N) regardless of pixel
size. Of course this is contrary to internet wisdom, but is based on real physics,
not internet physics.
How to Compare Cameras
Above I discussed comparing banding (pattern noise) in images. That is subjective.
With the quantitative values in the review, the performance of a sensor in a camera can
be compared. The best is by example. Consider a Canon 5D Mark III and a 7D Mark I
camera. Which produces the better images? Common knowledge on the internet is the larger sensor.
Remember Figure 9 above, where I showed that it is the lens that collects the light.
The larger pixel can hold more light, so if the exposure is long enough, and using the
same aperture diameter lens, the small pixel will overflow before the large pixel, much like
a small bucket will fill up with water before a large bucket.
Below (Table 0) shows example maximum signal per pixel from my Canon 5DIII and Canon 7D reviews.
The traditional way photographers compare cameras is to use the same ISO on all cameras.
But ISO is not an absolute gain, it varies with pixel size. Table 0a shows 2 cameras compared
where each line is the same ISO. But note that the maximum signal level is different.
Now compare the cameras in Table 0b. There I have aligned the rows to get the closest
maximum signal. Then note the gains and dynamic range more closely tracks. This comparison
says one can get the same signal-to-noise ratio on the 7D by operating it at on stop lower than
a 5D Mark III.
                                     Table 0a
           Canon 5D Mark III                                   Canon 7D Mark I
------------------------------------------------- -------------------------------------------------
               Apparent  Maximum     Measured                   Apparent  Maximum     Measured
  ISO  Gain   Read Noise  signal    Dynamic range  ISO  Gain   Read Noise  signal    Dynamic range
       e/DN  (electrons) (electrons)   stops            e/DN  (electrons) (electrons)   stops

   100  5.04     34.9     68900        10.9         100  2.15     12.1     24800        11.0
   200  2.52     18.3     32400        10.8         200  1.23      7.6     16300        11.1
   400  1.26      9.8     16200        10.7         400  0.61      4.9      8150        10.7
   800  0.63      5.6      8100        10.5         800  0.31      3.8      4080        10.1
  1600  0.315     3.6      4050        10.1        1600  0.15      3.0      2040         9.4
  3200  0.157     2.7      2030         9.6        3200  0.077     2.7      1020         8.6
  6400  0.079     2.5      1000         8.6        6400  0.038    ~2.7       510         7.6
                                     Table 0b
           Canon 5D Mark III                                   Canon 7D Mark I
------------------------------------------------- -------------------------------------------------
               Apparent  Maximum     Measured                   Apparent  Maximum     Measured
  ISO  Gain   Read Noise  signal    Dynamic range  ISO  Gain   Read Noise  signal    Dynamic range
       e/DN  (electrons) (electrons)   stops            e/DN  (electrons) (electrons)   stops

   100  5.04     34.9     68900        10.9
   200  2.52     18.3     32400        10.8        100  2.15     12.1     24800        11.0
   400  1.26      9.8     16200        10.7        200  1.23      7.6     16300        11.1
   800  0.63      5.6      8100        10.5        400  0.61      4.9      8150        10.7
  1600  0.315     3.6      4050        10.1        800  0.31      3.8      4080        10.1
  3200  0.157     2.7      2030         9.6       1600  0.15      3.0      2040         9.4
  6400  0.079     2.5      1000         8.6       3200  0.077     2.7      1020         8.6
Derived Sensor Parameters
Each Table 1 in a review shows derived and related data from the manufacturer.
Example Review Table 1 here uses data for the Canon 7D Mark II.
             Table 1
--------------------------------------------------------------------------------------------
              Apparent    Maximum    S/N     Measured Dynamic range (photographic stops)
 ISO  Gain   Read Noise    signal    18%   -------------------------------------------------
     (e/DN   (electrons  (electrons  gray  per pixel  Normalized to   Film Reference
     /pixel)   /pixel)     /pixel)   card   (stops)    8 megapixels   48-micron spot
                                                        (DXO)        (Kodak Specification)
  100  2.74     15.        31800     75.7     11.0       12.4            17.8
  200  1.34      7.8       17800     56.6     11.2       12.5            18.0
  400  0.67      4.6        8910     40.4     10.9       12.2            17.7
  800  0.34      3.2        4520     28.5     10.5       11.8            17.3
 1600  0.168     2.4        2230     20.4      9.9       11.2            16.6
 3200  0.084     1.9        1110     14.1      9.2       10.5            15.9
 6400  0.042     1.7         560     10.0      8.4        9.7            15.1
12800  0.021     1.6         279      7.1      7.4        8.8            14.1
The Gain is expressed in electrons (e) per Analog-to-Digital Converter Data Number (DN),
per pixel. The DN, also called ADU for Analog Digital Unit, is the numbers in the raw file
if they have not been digitally scaled before recording the raw data in the camera.
Using the gain factors, one can calibrate any digital raw data to photons (light).
One electron corresponds to one photon. The gains apply equally to the red, green and
blue channels. For detection of low light signals, an ISO (gain) of about 0.2
work well. Note, the gain factor is the inverse of what most people think of
amplification gain where a larger number means more gain. The gain for sensors
in this way was defined be electronics sensor engineers decades ago.
The gain is most useful to those wanting to do science with their digital cameras.
But the gains are critical for deriving the amount of light each pixel records
and the noise in absolute terms that then allows proper comparisons between cameras.
Apparent read noise is the noise floor expressed in electrons per pixel.
One wants this to be as low as possible. The Apparent read noise is a combination
of the Sensor read noise plus noise from downstream electronics.
Sensor read noise does not vary with temperature or ISO (remember
ISO does not change the sensitivity of the sensor; it is a post sensor amplification).
It is apparent that in the above example, that the Apparent read noise increases
as ISO decreases. This is true for all cameras I have tested or seen data for
that others have tested, just the magnitude of the change varies between cameras.
Ideally there would be no change with ISO and the number would be low.
The read noise is important for photographers as it indicates how faint
a signal one can detect, which is important in low light situations,
whether fast exposure in action photography, recording detail in deep shadows, to moderately long
exposure times of a few seconds (thermal noise dominates in most situations
with longer exposure times).
Under 3 electrons apparent read noise is impressive and under 2 electrons is amazing.
Maximum signal is the maximum number of photoelectrons that a pixel can
hold. A photoelectron is an electron trapped in a pixel as a result of
the energy of one photon being absorbed in the pixel. Think of this number like
going to the hardware store to buy a bucket: a larger bucket will hold more water.
A larger pixel will hold more photoelectrons. The more electrons, the cleaner
(less apparent noise) the resulting image will appear (higher signal-to-noise ratio).
The maximum signal is pretty well fixed to pixel area. The maximum is approximately
2000 electrons per square micron at the lowest ISO. For example, the 7D Mark II
in the above table has a pixel size of 4.09 x 4.09 = 16.7 square microns.
Thus we would expect the maximum signal to be about 16.7 * 2000 = 33,400 electrons,
which is within a few percent of the measured 31,800 electrons. The lowest ISO may be
affected by sensor saturation, so the next highest factor of 2 ISO is a better indicator
and would be about 1000 electrons per square micron. The 7D2 at ISO 200 has
17,800 electrons maximum signal, slightly higher (6.6%) than 16,700
electrons given by the 1000 per square micron metric.
S/N 18% gray card is the maximum signal-to-noise ratio one can obtain
on an 18% gray card in a single exposure at each ISO if the exposure is set such that
a 100% reflectance white card just reached saturation. For reference, fine-grained
slide film, ISO 50, gave S/N 18% gray card of about 18 and produced beautiful images.
Once you have some experience with what S/N you want to achieve in your images, when
you get a new camera and with data like that shown here, you'll know the ISO that
will work best for your desired image quality.
The Measured Dynamic Range (photographic stops)
is given several ways.
per pixel The per pixel dynamic range is more appropriate to
when you are enlarging/cropping images and showing them near full
size, for example a distant bird made with a focal length limited lens
with the subject small in the frame.
Normalized to 8 megapixels (DXO) is the metric used by DXO Mark and refers
a constant output or print size regardless of lens or sensor size.
It normalizes by pixel averaging to an eight megapixel image. This gives
a distinct advantage to larger sensors and might be most appropriate
if you only make fixed size enlargements and do not crop.
Film Reference 48-micron spot (Kodak Specification) is the best
metric if comparing to film specifications. It could be used in those
film versus digital wars on the internet when someone brings up a specification
of how good film's dynamic range is. Otherwise it is more for
historical perspective.
Used by those who want to argue specifications.
Below the columnar table are numerous other parameters:
Sensor size is from the manufacturer (sometimes it is the best derivation I and/or
other technical people on the internet can derive when the manufacturer
uses obscure information like 1950s vidicon TV tube size, like 1/1.3").
Pixel pitch is the distance from the center of one pixel to the next. It is derived from
the sensor size (above) divided by the image size (below).
Image size: is from the manufacturer or from raw data files from the camera.
Maximum signal-offset: is the maximum data range (DN) in the
digital file for which we detect the range in the light signal from the subject.
Used by those who want to argue specifications.
Offset is the zero level in the digital file (units of DN) that
correspond to zero light. We want this value to be positive because if it is near
zero or negative, noise can cause some measured values to go below zero
and truncate data. Many Nikon cameras prior to 2014 have zero to negative
offsets. Canon commonly has an offset around 2048 (on a 14-bit scale, 0 to 16384,
that eats into the total range reducing slightly the tonality one can record).
Some newer Nikons have an offset of about 600, which seems more reasonable.
There are post processing pitfalls to a high offset; see:
Processing Canon Raw Image Data to Maximize Dynamic Range.
Sensor Full Well Capacity at lowest ISO: the maximum capacity of the camera
to record light, given in electrons (photons). Good for techies to argue about.
Used by scientists to do science. Most photographers do not need to know this.
Sensor dynamic range is the dynamic range of the sensor per pixel
in photographic stops if downstream
electronics did not add any noise. Compare with the dynamic range per
pixel at base ISO and the difference is due to added noise by the electronics.
With better downstream electronics, the sensor could deliver this level.
As measured dynamic range reached this level at lowest ISO, it indicates
the camera has excellent electronics, and with read noise under 2 to 3
electrons indicates quite mature technology.
Normalized dynamic range is the method used by DXO Mark for
their Landscape metric which normalizes by pixel averaging to an eight
megapixel image. Expressed in photographic stops. Use this number
when comparing to DXO's numbers. Also reasonable for constant
output (like 8x12-inch prints) when you do not crop.
Pixel linear density is the number of pixels per millimeter.
A larger number means to sensor can resolve finer details, but means
the sensor has smaller pixels so has a lower maximum signal.
See sensor sizes below. A larger number means you'll get more detail
on a distant subject given a quality lens. As this number increases,
lens quality must also increase if there is to be any benefit to
show more detail on the subject.
Pixel density is the number of pixels in one square mm. A larger
number means to sensor can resolve finer details, but means the sensor
has smaller pixels so has a lower maximum signal.
Add pixels together to increase signal-to-noise ratio if needed.
Sensor maximum signal density at ISO 200 is given in electrons / square micron.
Expected values are about 1000 electrons / square micron.
Lower values (e.g. below about 900 indicate old sensor technology).
Values above about 1200 likely produce artifacts from electrons leaking out
of pixels.
Sensor maximum signal density at ISO 1600 is given in electrons / square micron.
Expected values are about 125 electrons / square micron (1/8 the value
of the Sensor maximum signal density at ISO 200, above).
Sensor read noise density (best read noise) is given in electrons / square mm.
Values below 500 are excellent. I may change this parameter to use a smaller are
in the future.
Sensor dynamic range density at ISO 1600
is the maximum signal capacity at ISO 1600 summed over 1 square millimeter
divided but the Sensor read noise density summed over 1 square millimeter. The result
is given in photographic stops / square mm.
I may change this parameter to use a smaller are in the future.
Low Signal Pattern noise is a subjective interpretation of the
presence (or not) of banding and other pattern noise as shown in Tables
2a and 2b.
Dark current is given at a temperature along with the
doubling temperature. The dark current is given in electrons/pixel/second.
This is more important than read noise in low light long exposure performance.
Noise from the dark current is the square root of the dark current
times the exposure time. For example, if the read noise is 0.1
electrons/pixel/second and you do a 100 second exposure, the dark current
would be 0.1 * 100 seconds = 10 electrons/pixel. The noise would then
be square root (10) = 3.2 electrons. If the read noise was 2 electrons,
the noise from dark current is greater and the total noise adds as the
square root of the sum of the squares. In this example, total noise
would be sqrt (2*2 + 3.3*3.3) = 3.9 electrons. It is not uncommon for
some astronomical objects to only bring in about 1 photon per minute with
a fast lens. If noise from dark current is greater than that, it will be
difficult to detect that object. Dark current is temperature dependent
and most modern CMOS digital cameras, circa 2008 and later have on sensor
dark current subtraction, but while the dark current level is subtracted,
the noise from the dark current still accumulates.
It is important to note that cameras that have on-sensor dark current
suppression can do very well at keeping the dark current from adding
to the signal from the subject, but can not suppress the noise that
accumulates from the dark current.
Dark current Doubles every xx C, meaning every increase in
temperature by xx centigrade, the dark current will double. If dark
current at 10 degrees C were 0.1 electrons/pixel/second and the
doubling rate were 5 C, then at 15 C the dark current would be 0.2
electrons/pixel/second, and at 5 C, the dark current would be 0.05
electrons/pixel/second. This is very important to know for long exposure
low light photography.
New Low Light sensitivity Factor Ignore this for now. I have
been trying to make a consistent metric and with banding issues, the
problem is complex. For now it is better to just choose a moderate to
high ISO that does not show banding in the Figures in Table 2.
Full Sensor Apparent Image Quality, FS-AIQ is a metric for overall
image quality utilizing the full sensor:
sqrt(0.18*Full well capacity in electrons) * megapixels / 20.0 and is
described and compared to other sensors here:
Full Sensor Apparent Image Quality (FSAIQ).
Focal Length Limited Apparent Image Quality, ISO 1600,
Constant output Size, FLL-AIQ1600 Is a measure image quality
in situations where you want to resolve the most detail as possible
on a subject, for example, the Moon with a sort telephoto lens,
or a bird or other subject when it is small in the frame.
FLL-AIQ1600 = pixels/mm * StoN18 at ISO 1600 * square root(dynamic
range density/15 stops)/42
and is described here:
Focal Length Limited Apparent Image Quality FLL-AIQ.
Dark Current
Dark current is often the most limiting factor in recording faint
details as in astrophotography, nightscape photography, and other
long exposure low light photography, unless temperatures are very low
(e.g. sub freezing). See the discussions of dark current above.
An illustration of what a difference dark current can make is
shown in Figure 11. The images were made at similar temperatures
under similar sky conditions with a 300 mm f/2.8 lens. The difference is due
to an approximately 10 times lower dark current in the camera used for
the image on the left. In both images, there was no dark frame subtraction
because it is not needed as the sensors have on-sensor dark current suppression
(but can't suppress the noise from the dark current).
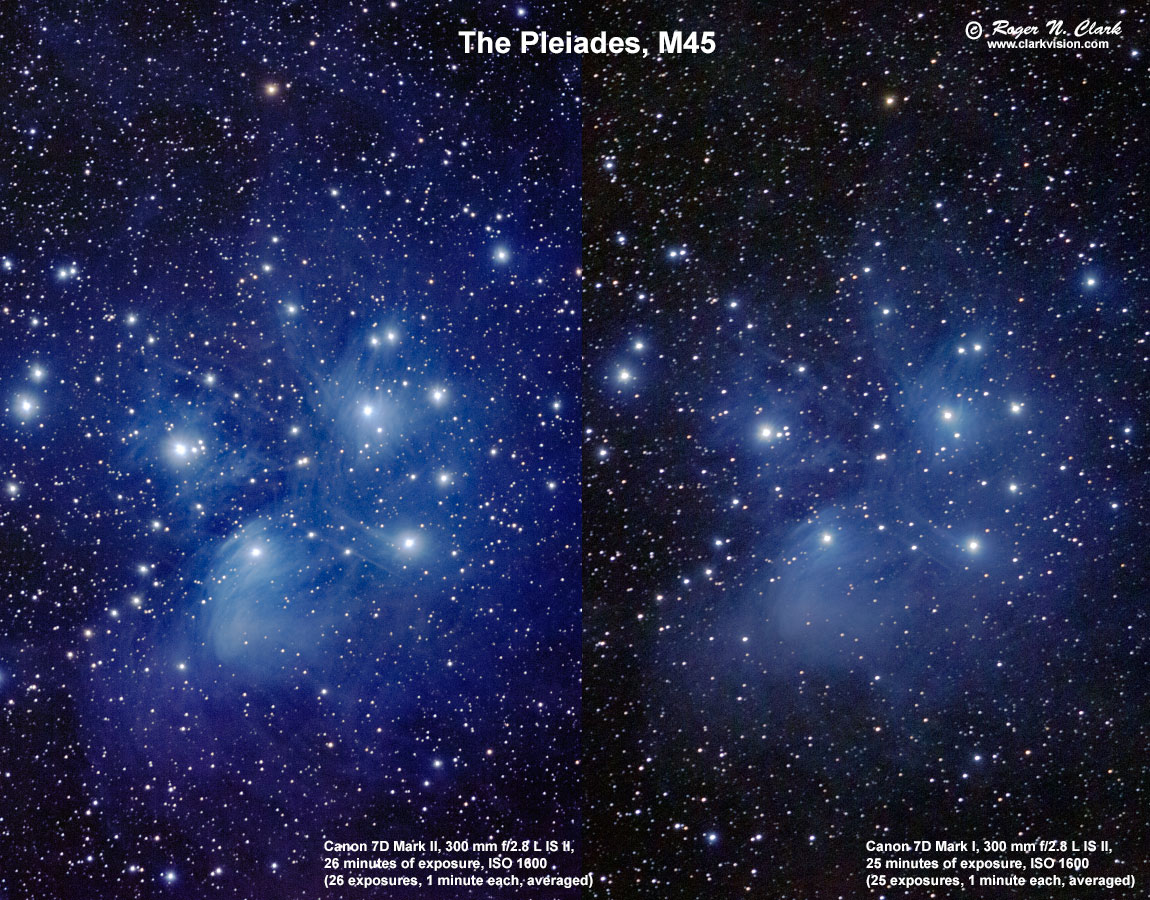
Figure 11. A comparison of long exposures on the Pleiades star cluster
showing faint blue reflection nebula. The sky conditions were very similar
for both images. The reason why the 7D2 recorded much more and fainter detail
is because of the lower dark current. No dark frames subtraction (not needed),
no flat fields (lens profile in the raw converter does that).
See the full details of each image
here for the 7D2 and
here for the 7D1.
Conclusions
Clarkvision reviews contain information difficult to impossible to find elsewhere on the
internet. The reviews show you what is more important for imaging performance
than simply a couple of numerical scores.
If you find the information on this site useful and wish to purchase the equipment
that I use to make images, please use
the links to B&H Photo to make the purchases. By using the link, you will help support
clarkvision.com at no additional cost to you. I have used B&H Photo for decades and
have always had a great experience and their prices are very good.
Please support Clarkvision; make a donation (link below).
Other Recommended Review Sites
I have already discussed that to compare real camera performance between
models the data needs to be referenced to the light from the subject,
e.g. data presented in electrons (and photons from the subject). At this
time I am recommending only one other site:
Photons to Photos, by Bill Claff.
Photons to Photos includes data for many cameras, e.g. read noise versus ISO.
References
Digital Sensor Performance summary
See comparisons of dark frames from many cameras at:
Digital Cameras and Long Exposure Times:
Noise and Dark Current Comparisons
Procedures for Evaluating Digital Camera Noise, Dynamic Range, and Full
Well Capacities; Canon 1D Mark II Analysis
1)
CCD Gain. http://spiff.rit.edu/classes/phys559/lectures/gain/gain.html
Notes:
DN is "Data Number." That is the number in the file for each
pixel. I'm quoting the luminance level (although red, green
and blue are almost the same in the cases I cited).
16-bit signed integer: -32768 to +32767
16-bit unsigned integer: 0 to 65535
Photoshop uses signed integers, but the 16-bit tiff is
unsigned integer (correctly read by ImagesPlus).
The sensor analysis done on clarkvision use custom, in-house written software. Raw data were
extracted from the camera raw files using DCRAW or Rawdigger. Custom software read
that data and all processing was done in 32-bit floating point
using Davinci (davinci.asu.edu) and linux shell scripts.
Back to:
Reviews Main Page.
http://clarkvision.com/reviews/evaluation-canon-6d
First published December 29, 2014.
Last updated October 9, 2017.