How to Interpret Digital Camera Sensor Reviews:
Sensor Noise, Thermal Noise, Dynamic Range, and Full Well Analysis .
The early review of this camera was made possible by
Hunt's Photo and Video.
Hunts has always come through for me when I needed hard to get photo gear, such
as the 7D Mark II when it first came out. Purchase the
7D Mark II from Hunts here
(note I am not an affiliate of Hunts, but they are a great company).
If you find the information on this site useful and wish to purchase the equipment
that I use to make images, please use
the links to B&H Photo to make the purchases. By using the link, you will help support
clarkvision.com at no additional cost to you. I have used B&H Photo for decades and
have always had a great experience and their prices are very good.
Please support Clarkvision; make a donation (link below).
 Click here to go to B&H Photo and Purchase the Canon EOS 7D Mark II DSLR Camera.
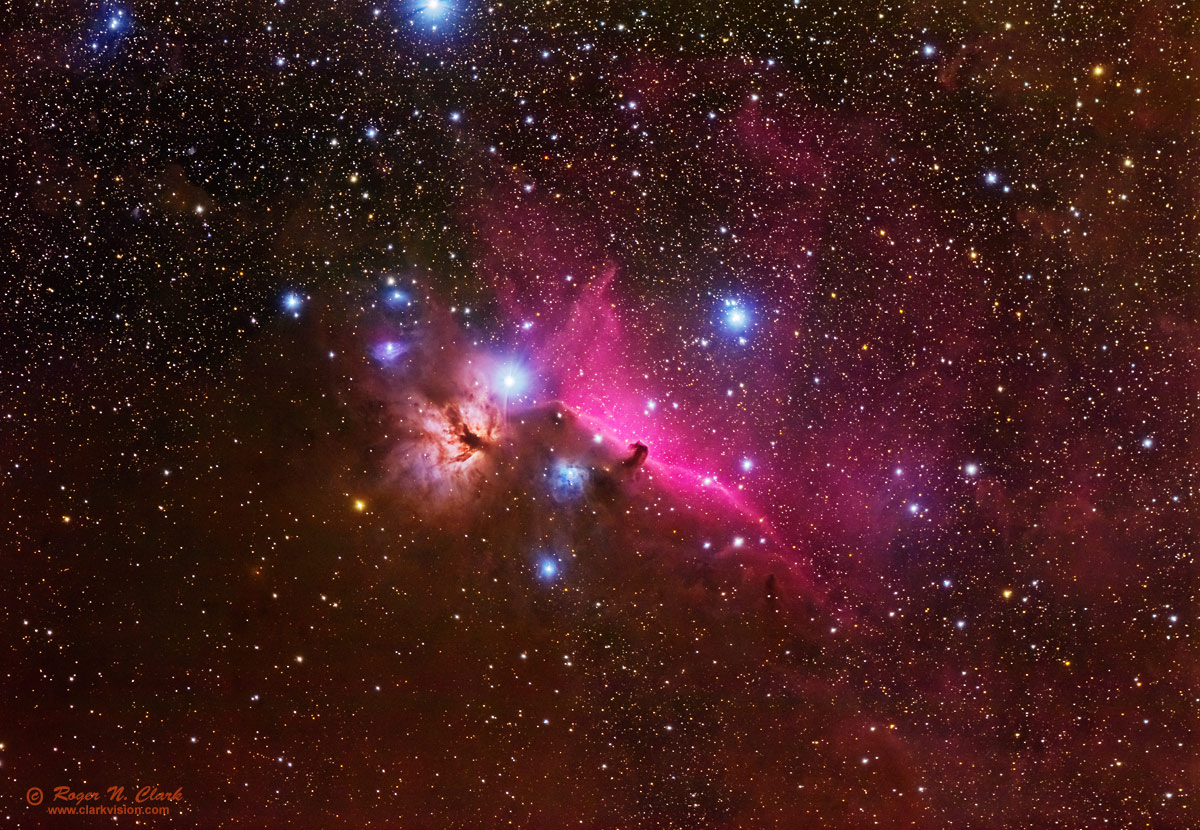
Figure 1. Illustration of the amazing capability of the Canon 7D Mark II
digital camera is demonstrated in this 70 minute exposure (seventy 1-minute exposures averaged)
of the very faint Horsehead nebula in the constellation of Orion. The faintest
areas in the image, the very faint red splotches, had less than 1 photon per minute per pixel
collected by the sensor. This represents a lifting of the low end much greater than would
be done in the typical wildlife or landscape scene, and yet shows no banding problems.
No other canon camera currently in production can do that
and deliver such a clean signal. This image has had no long exposure noise
reduction, no dark frame subtractions nor other typical astrophoto processing--just
convert the raw files, align the images, average, and stretch.
Read more about this image at:
The Deep Sky Region of the Horsehead Nebula in Orion
The new autofocus system in the 7D Mark II is of pro quality and places this camera in a
new class along side sports pro cameras. I have tested the autofocus
system in several environments including birds in flight (Figure 2a, 2b).
The 7D Mark II is a lighter replacement for my Canon 1D Mark
IV for wildlife action photography. This will now be my camera
of choice for African safaris, birds in flight, and other action photography.
The advantage is be the much lighter camera and batteries as well as the
lighter and smaller battery charger.
In February 2015 I took the 7D Mark II on safari to Tanzania. I obtained about
12,000 images with the camera. Performance in action on all kinds of subjects
have proven quite impressive. I obtained more superbly sharp images than
on previous trips with a Canon 1D Mark IV. In general, the limits were my ability
to get focus points on fast moving subjects. If I could achieve that, the camera
performed very well. See the
Canon 7D Mark II photo gallery.
I'll be adding more images from my trip and all future images I put on my
website with this camera will appear here, as well as in topical galleries.
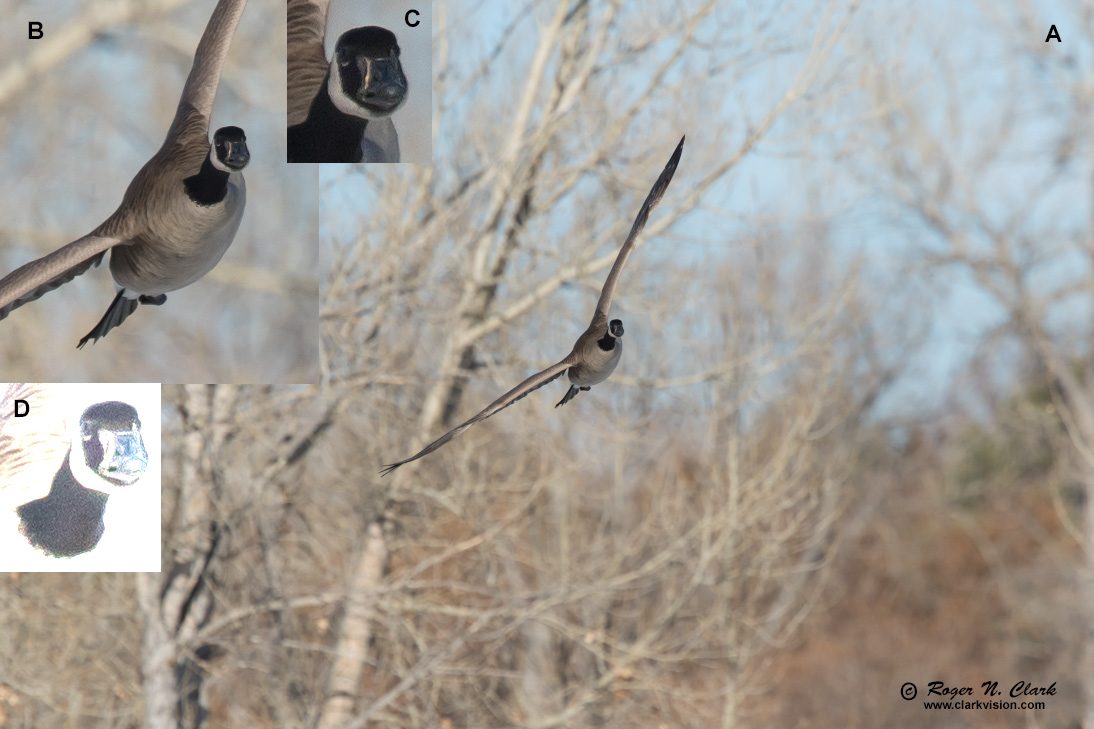
Figure 2a. Example bird in flight image showing the impressive
autofocus system of the Canon 7D Mark II. Image with the 7D Mark II,
300 mm f/2.8 L IS version II, 1.4x teleconverter (version II), 1/4000
second exposure at ISO 400, f/5.6, AI servo tracking using Case 2, single
AF point, raw conversion in photoshop ACR 8.7 to a 16-bit tiff file. The dark bird is low
contrast with a brighter complex background and the bird is flying almost
directly at the camera so presents a low profile, yet the camera tracked
the subject very well A) full frame image. Insets: B) enlargement to 50%,
C) enlargement to 100% (one image pixel to one pixel on the screen), D)
bring up the low end with levels (right slider moved from 255 down to 64).
Note that in (D) there is no visible banding patterns in the dark areas.
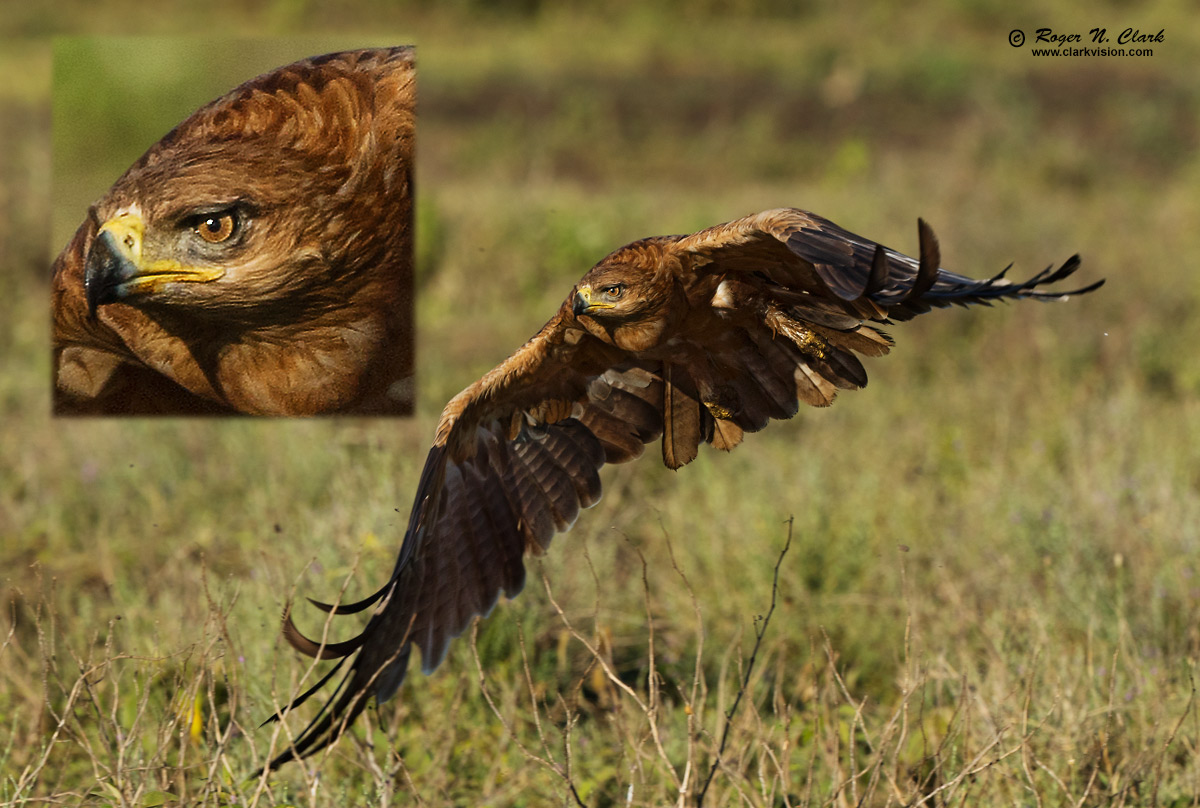
Figure 2b. Tawny eagle coming in to a kill on the Serengeti
with a complex foreground and background. Tracking and autofocus speed
proved amazing in this case and in other images I made on
safari in the Serengeti in February 2015 with the 7D Mark II
camera and 300 f/2.8 L IS version II lens.
Gallery page is HERE.
The pattern (banding) noise of the 7D Mark II sets new lows for Canon
(that is good), lower than the Canon 6D, which is now second best in
this regard. With low read noise, the 7D Mark II camera is superb for
low light work.
There is much confusion on the internet about this camera. Most who criticize noise
fail to understand EXPOSURE ON THE SUBJECT. Read more about this issue here:
Exposure and Digital Cameras: Understanding Exposure.
Also, many comparisons on the internet fail to equalize the Etendue between cameras.
That changes the light delivered to the camera and thus the noise. Understanding
Etendue allows one to get the desired image quality with various lenses and
sensors with all the different pixel and sensor sizes available today.
For example, given the lenses, one can produce the same image quality from a
large pixel 1DX camera as with the 7D2, and using the same exposure time.
Read more about Etendue in the understanding exposure article (above, and at:
Telephoto + Camera System Performance (A Omega Product, or Etendue).
The 7D mark II has very small pixels for a DSLR. To get all the detail in
an image that the sensor is capable of delivering, you need very sharp lenses.
Most zoom lenses, especially consumer zoom lenses will result in soft images
from this sensor as the lenses can't deliver the image quality. Also, one
needs to use excellent technique to take advantage of this sensor.
Remember, it is the lens plus the exposure time that delivers the light and the detail
to the sensor. The sensor just collects the light delivered by the lens and exposure time.
Deliver the light to the 7D2 and it will record stunning images.
The lowest possible noise from a
system detecting light is the noise due to Poisson statistics
from the random rate of the arrival of photons. This is called
photon statistics, or photon noise. Noise from the electronics
will add to the photon noise.
Noise in Canon 7D Mark II images are limited by photon statistics at high
signal levels and by electronic noise from reading the sensor
(called readout noise) and noise from the downstream electronics at very low signal levels.
In the case of high signal levels, a system that is photon statistics
limited enables us to directly measure how many photons
the sensor captures, and by increasing the exposure, we can
determine how many photons are required to saturate the
sensor. This is called the full well capacity, or simply, maximum signal capacity.
With data on the lowest noise to the highest signal, we can then
determine the dynamic range of the sensor and predict image quality for many
situations.
Results: Canon 7D Mark II sensor analysis
             Table 1
--------------------------------------------------------------------------------------------
              Apparent    Maximum    S/N     Measured Dynamic range (photographic stops)
 ISO  Gain   Read Noise    signal    18%   -------------------------------------------------
     (e/DN   (electrons  (electrons  gray  per pixel  Normalized to   Film Reference
     /pixel)   /pixel)     /pixel)   card   (stops)    8 megapixels   48-micron spot
                                                        (DXO)        (Kodak Specification)
  100  2.74     15.        31800     75.7     11.0       11.7            17.8
  200  1.34      7.8       17800     56.6     11.2       11.9            18.0
  400  0.67      4.6        8910     40.4     10.9       11.6            17.7
  800  0.34      3.2        4520     28.5     10.5       11.2            17.3
 1600  0.168     2.4        2230     20.4      9.9       10.6            16.6
 3200  0.084     1.9        1110     14.1      9.2        9.9            15.9
 6400  0.042     1.7         560     10.0      8.4        9.1            15.1
12800  0.021     1.6         279      7.1      7.4        8.1            14.1

Sensor size = 22.4 x 15.0 mm
Pixel pitch: 4.09 microns.
Image size: 5472 x 3648 pixels = 20.0 megapixels.

Maximum signal-offset:  ISO 100: 11592, ISO 200+: 13304
Offset= 2048
Sensor Full Well Capacity at lowest ISO: 31,800 electrons.
Sensor dynamic range = 31800/1.6 = 19,900 = 14.3 stops (not the camera delivered range).
Normalized dynamic range is the method used by DXO Mark for their Landscape metric
           which normalizes by pixel averaging to an eight megapixel image.
           For the 7D2, this increases dynamic range by ln(sqrt(20/8))/(ln2) 0.66 stops

Pixel linear density = 244 pixels / mm
Pixel density = 59779 pixels / square mm
Sensor maximum signal density at ISO 200 = 1064 electrons / square micron
Sensor maximum signal density at ISO 1600 = 133 electrons / square micron
Sensor read noise density (best read noise) = 391 electrons / square mm
Sensor dynamic range density at ISO 1600 = 18.3 stops dynamic range / square mm
Low Signal Pattern noise: virtually non-existent.

Dark current at 10 degrees C = 0.016 electrons/pixel/second
Dark current Doubles every     4.8 C

New Low Light sensitivity Factor: 55.4 (= sensor max signal density at ISO 1600 / read noise at ISO 1600)
Full Sensor Apparent Image Quality, FS-AIQ = 75.7
Focal Length Limited Apparent Image Quality, ISO 1600, Constant output Size, FLL-AIQ1600 = 131
-------------------------------------------------
Sensitivity
The internet is abuzz over how much more sensitive the 7D2 camera is over the original 7D.
One can't really determine this without calibrated sources. To answer this question,
I built a custom artificial star field with a large range in "star" brightnesses.
I measured the number of photons received by each camera for stars in a given exposure.
I used the same lenses on both the7D Mark I and 7D Mark II. I find the 7D Mark II
records 14% (0.2 stop) more light than the 7D Mark I.
The reports on the internet are all over the place on more sensitive/better noise or not.
The new 7D pushes the noise floor down significantly and raises the sensitivity
by 0.2 stop. Depending on your ISO settings, you see varying amounts of improvement
over the 7D Mark I, but there is improvement at all ISO's. Learn to expose correctly
with the right lenses and this camera can give excellent results.
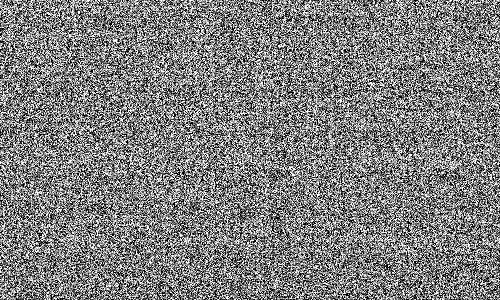
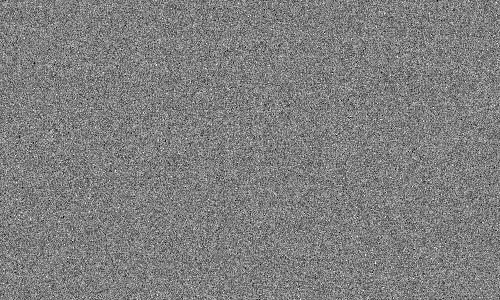
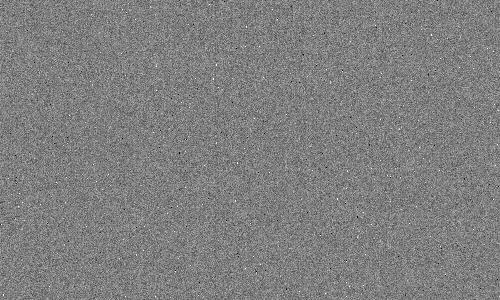
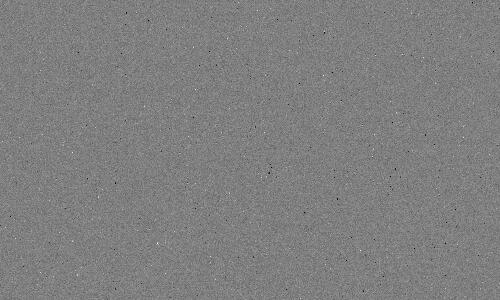
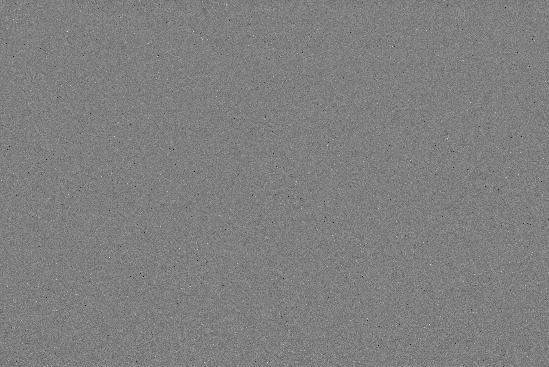
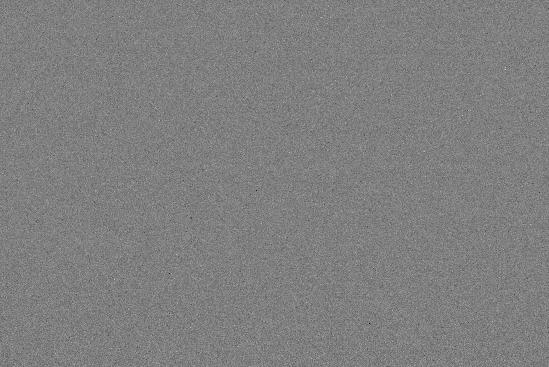
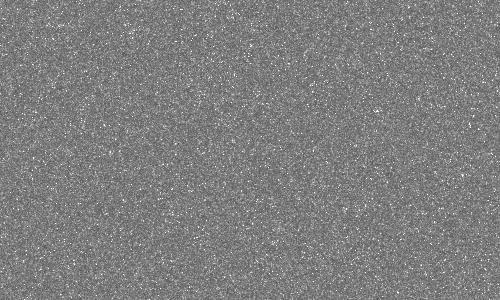
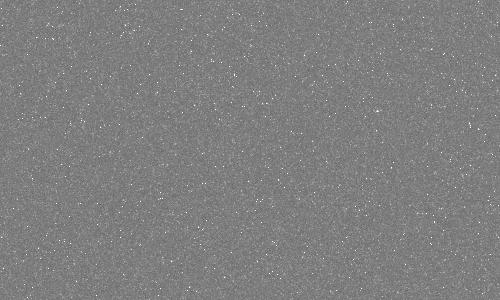
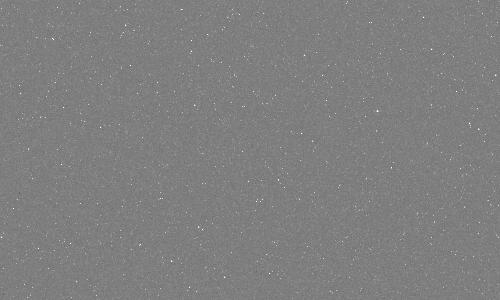
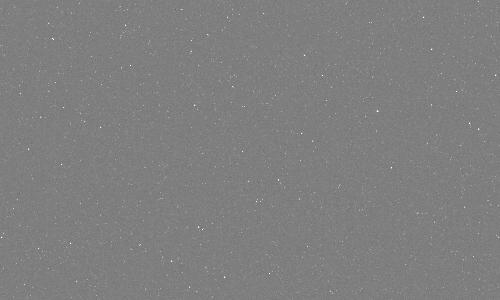
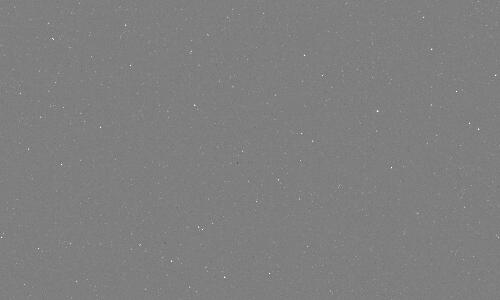
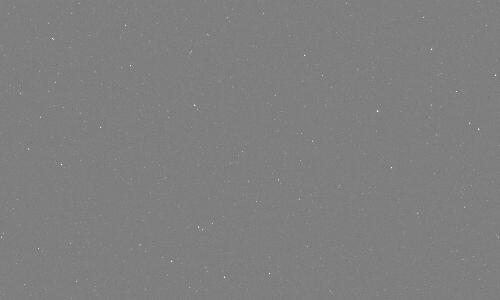
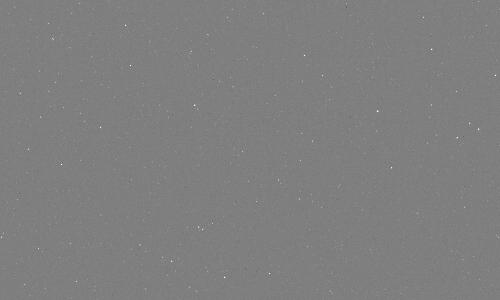
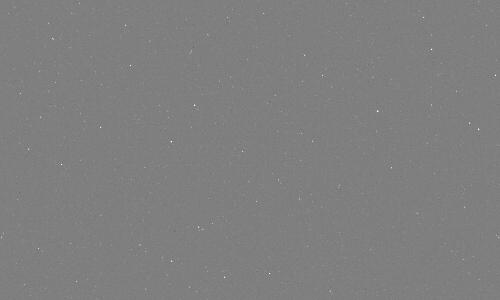
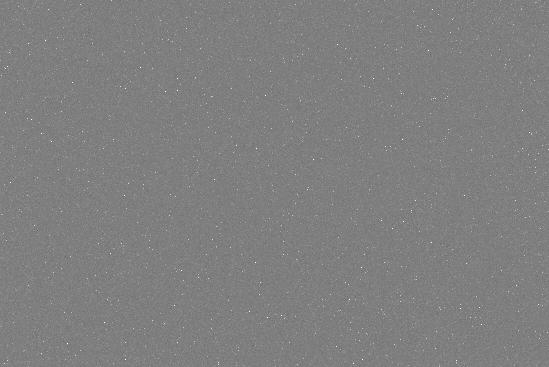
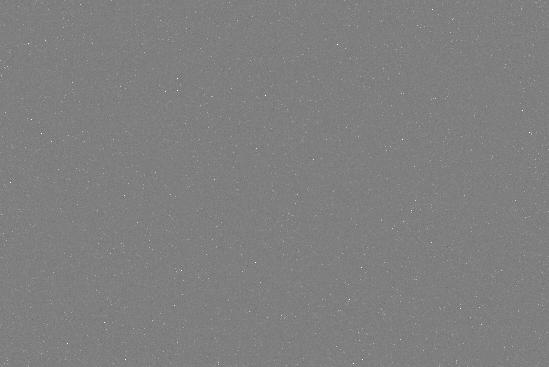
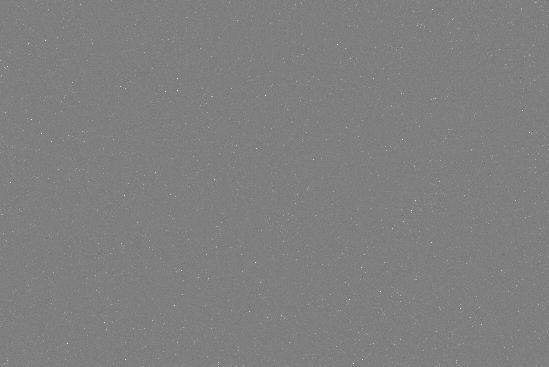
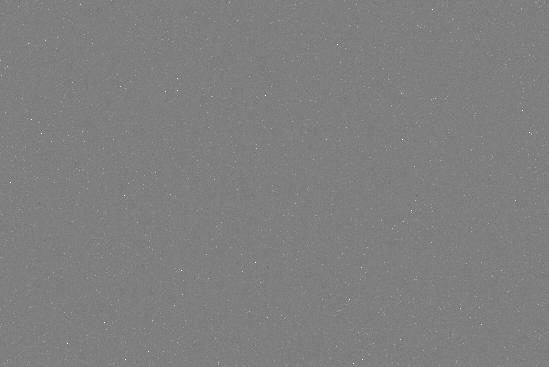
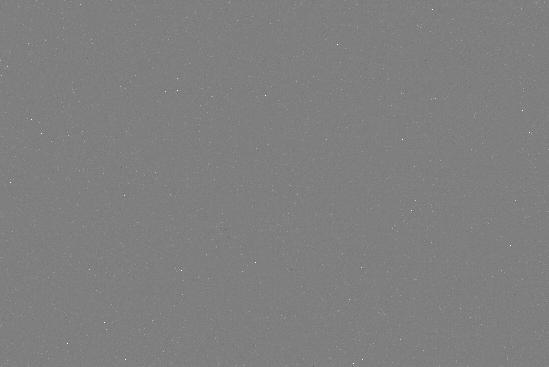
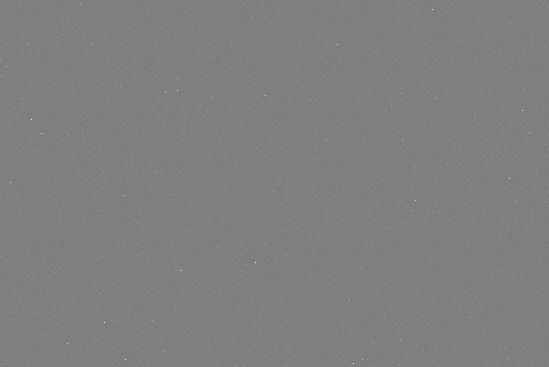
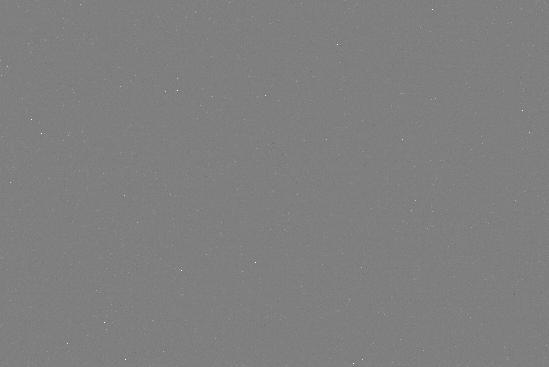
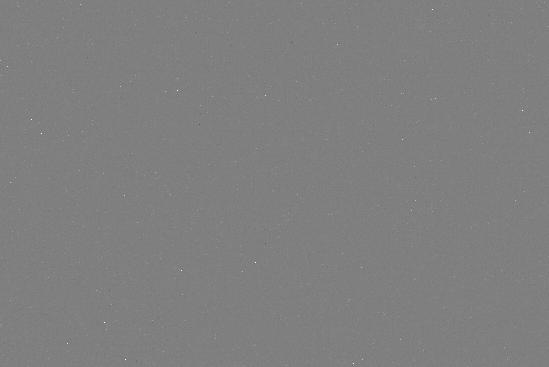
Fixed Pattern (Banding) Noise
Table 2 shows the noise as a function of ISO in image form. The images
illustrate several things: 1) lower banding noise at higher ISOs. 2)
Better detection of smaller signals at higher ISOs (the random noise
on the subject decreases). 3) At a certain high ISO, improvements decrease, meaning
there is no benefit to higher ISO. Note, ISO is a post sensor gain
and does not increase sensitivity. Increasing ISO digitizes a smaller
range (see Table 1) but does improve the noise floor up to a point.
For night and low light photography, ISO 1600 produces excellent results
and there should be little need for going to higher ISOs (which have a detrimental effect of
lower dynamic range). Only go to higher ISOs when dynamic range of the scene is low
and you need to detect the very faintest subjects.
The 7D Mark II camera has the LOWEST fixed pattern noise at all ISOs than
any other Canon camera that I have tested to date, including the Canon 1DX and 6D
(as of November, 2014).
The images presented in tables 2a, and 2b show consistent random patterns. That indicates that
the raw data are clean and no significant filtering is being applied before the
raw data are written.
| Table 2a. Apparent Read Noise, Central Image |
 | ISO 100
Image Range:
-20.00 to 20.00 electrons about the mean
Central 500 x 300 pixel statistics:
min= 5543 electrons
max= 5677 electrons
mean= 5609 electrons
standard deviation= 14.95 electrons
0 pixels =zero (0.000000%) |
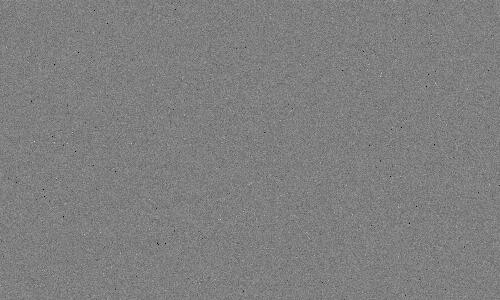
 | ISO 200
Image Range:
-20.00 to 20.00 electrons about the mean
Central 500 x 300 pixel statistics:
min= 2679 electrons
max= 2810 electrons
mean= 2743 electrons
standard deviation= 7.87 electrons
0 pixels =zero (0.000000%) |
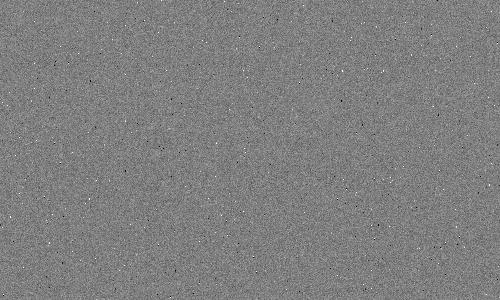
 | ISO 400
Image Range:
-20.00 to 20.00 electrons about the mean
Central 500 x 300 pixel statistics:
min= 1309 electrons
max= 1440 electrons
mean= 1372 electrons
standard deviation= 4.66 electrons
0 pixels =zero (0.000000%) |
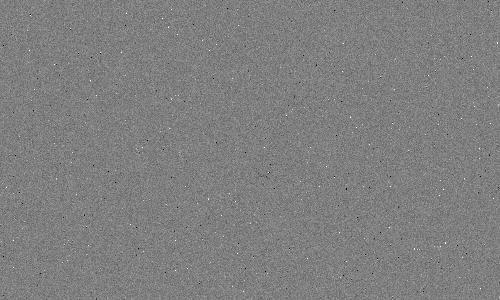
 | ISO 800
Image Range:
-20.00 to 20.00 electrons about the mean
Central 500 x 300 pixel statistics:
min= 647 electrons
max= 769 electrons
mean= 696 electrons
standard deviation= 3.27 electrons
0 pixels =zero (0.000000%) |
 | ISO 1600
Image Range:
-20.00 to 20.00 electrons about the mean
Central 500 x 300 pixel statistics:
min= 293 electrons
max= 397 electrons
mean= 344 electrons
standard deviation= 2.49 electrons
0 pixels =zero (0.000000%) |
 | ISO 3200
Image Range:
-20.00 to 20.00 electrons about the mean
Central 500 x 300 pixel statistics:
min= 138 electrons
max= 208 electrons
mean= 172 electrons
standard deviation= 1.96 electrons
0 pixels =zero (0.000000%) |
 | ISO 6400
Image Range:
-20.00 to 20.00 electrons about the mean
Central 500 x 300 pixel statistics:
min= 54 electrons
max= 108 electrons
mean= 86 electrons
standard deviation= 1.68 electrons
0 pixels =zero (0.000000%) |
 | ISO 12800
Image Range:
-20.00 to 20.00 electrons about the mean
Central 500 x 300 pixel statistics:
min= 3 electrons
max= 59 electrons
mean= 43 electrons
standard deviation= 1.63 electrons
0 pixels =zero (0.000000%) |
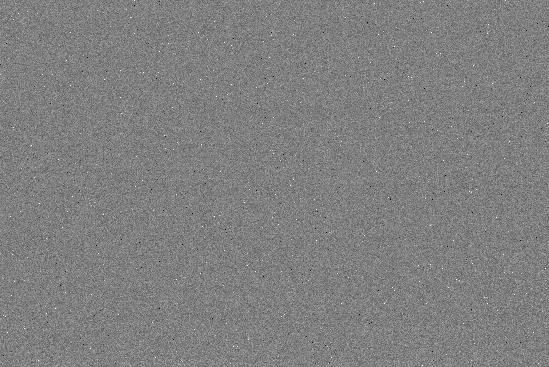
| Table 2b. Apparent Read Noise, Full Image, sub-sampled |
 | ISO 100
Image Range:
-20.00 to 20.00 electrons about the mean
Full image statistics:
min= 5516 electrons
max= 6096 electrons
mean= 5609.1 electrons
standard deviation= 14.92 electrons
0 pixels =zero (0.000000%) |
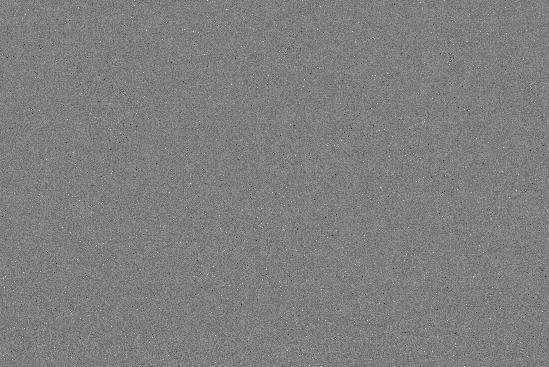
 | ISO 200
Image Range:
-20.00 to 20.00 electrons about the mean
Full image statistics:
min= 2661 electrons
max= 3197 electrons
mean= 2743.3 electrons
standard deviation= 7.84 electrons
0 pixels =zero (0.000000%) |
 | ISO 400
Image Range:
-20.00 to 20.00 electrons about the mean
Full image statistics:
min= 1280 electrons
max= 1826 electrons
mean= 1371.6 electrons
standard deviation= 4.67 electrons
0 pixels =zero (0.000000%) |
 | ISO 800
Image Range:
-20.00 to 20.00 electrons about the mean
Full image statistics:
min= 573 electrons
max= 1153 electrons
mean= 696.3 electrons
standard deviation= 3.28 electrons
0 pixels =zero (0.000000%) |
 | ISO 1600
Image Range:
-20.00 to 20.00 electrons about the mean
Full image statistics:
min= 275 electrons
max= 636 electrons
mean= 344.1 electrons
standard deviation= 2.49 electrons
0 pixels =zero (0.000000%) |
 | ISO 3200
Image Range:
-20.00 to 20.00 electrons about the mean
Full image statistics:
min= 127 electrons
max= 221 electrons
mean= 172.1 electrons
standard deviation= 1.98 electrons
0 pixels =zero (0.000000%) |
 | ISO 6400
Image Range:
-20.00 to 20.00 electrons about the mean
Full image statistics:
min= 43 electrons
max= 121 electrons
mean= 86.0 electrons
standard deviation= 1.71 electrons
0 pixels =zero (0.000000%) |
 | ISO 12800
Image Range:
-20.00 to 20.00 electrons about the mean
Full image statistics:
min= 2 electrons
max= 122 electrons
mean= 43.0 electrons
standard deviation= 1.67 electrons
0 pixels =zero (0.000000%) |
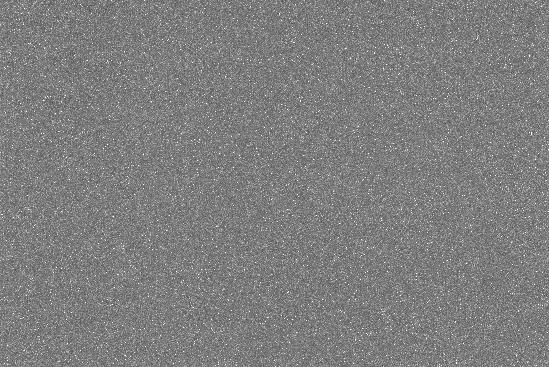
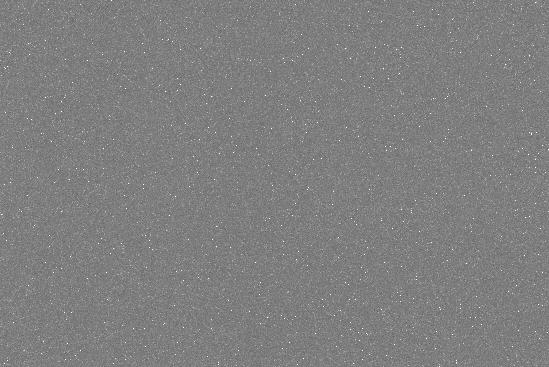
Dark Current and Thermal Noise
On long exposures, electrons collect in the sensor due to thermal
processes. This is called the thermal dark current. As with photon noise,
the noise from thermal dark current is the square root of the
signal. One can subtract the dark current level, but not the noise
from the dark current. Many modern digital cameras have on sensor
dark current suppression, but this does not suppress the noise
from the dark current. It does, however, prevent uneven
zero levels that plagues cameras before the innovation (Canon
cameras before circa 2008). Examples of this problem are seen
at:
Long-Exposure Comparisons.
The dark current versus temperature for the Canon 7D Mark II is shown in Figure 3 and in Table 3.
The uniformity of the 7D Mark II long exposure dark frames, Tables 4a, 4b, 4c
is outstanding.
The 7D Mark II results are compared to other cameras in Figure 3, where it is seen
that the 7D Mark II dark current is about a factor of 10 lower that other cameras.
That low dark current makes the 7D Mark II a game changer for long exposure
low light photography.
There is no noticeable banding (Tables 4a, 4b, 4c), enabling multiple
frames to be averaged, or very long exposures to be made without
annoying pattern noise. Thermal noise ultimately limits the weakest
signals that can be detected. Thermal dark current is very
temperature dependent, so only compare these values to other sensors made
at the same temperature.
The dark current in the 7D Mark II
doubles about every 4.8 degrees C on average. Note too that the
lower the temperature, the fewer hot pixels show in the image.
This makes long exposure night imaging more difficult in hot environments in general,
but the 7D Mark II is the best in the Canon lineup.
For example, the 7D Mark II in the 23 C range has dark current similar
to other cameras, like the 7D Mark 1) working at 3 C.

Figure 3.
Dark current as a function of temperature
are compared. Lower is better as noise from dark current is the
square root of the dark current multiplied by the exposure time. The
temperatures are the camera temperature reported in the camera's
EXIF data and was 2 to 10 degrees higher than measured ambient
temperature due to internal electronics heating the camera. The
more massive 1D cameras tended to have a larger difference between
internal camera and ambient temperature. The Canon 7D Mark II sets
new and impressively low levels making this the current top long
exposure low light camera in the canon line. Reports on cloudynights.com
say the Con 80D has the same dark current level as the 7DII.
The newer Canon R5 is tracking the 7DII line.
Sony sensor data are from commercial data sheets found online.
The Sony IMX455 is a flagship 61 megapixel sensor.
The Sony IMX455 data are from Alarcon et. al., 2023, and shows a
different trend line with temperature than the Canon sensors.
Note that the IMX455 has a dark current at -10C as the Canon 7DII at +6 C,
but at temperatures higher than about 20C the IMX455 would have lower
dark current (if the trend line holds). The IMX455 was introduced
in 2023 and has 3.76 micron pixels. The IMX585 has 2.9 micron pixels.
Note that the Hubble WFC3
camera, operating at -83 C, has dark current similar to that of a
modern uncooled DSLR or mirrorless camera operating at about 0 C.
                              Table 3
           Canon 7D Mark II Dark Current and Noise vs Temperature

                                     Noise from Dark Current in Electrons
 Temperature   Dark current            versus  Exposure Time (seconds)
  (C)   (F)   electrons/sec.    10 sec    30 sec    60 sec    120 sec    300 sec

   33    91     0.626             2.5       4.3       6.1       8.7       13.7
   30    86     0.381             2.0       3.4       4.8       6.8       10.7
   23    73     0.146             1.2       2.1       3.0       4.2        6.6
   23    73     0.084             0.9       1.6       2.2       3.2        5.0
   22    72     0.064             0.8       1.4       2.0       2.8        4.4
   19    66     0.043             0.7       1.1       1.6       2.3        3.6
   15    59     0.023             0.5       0.8       1.2       1.7        2.6
   12    54     0.022             0.5       0.8       1.2       1.6        2.6
   12    54     0.016             0.4       0.7       1.0       1.4        2.2
    4    39     0.0082            0.3       0.5       0.7       1.0        1.6
    0    32     0.0032            0.2       0.3       0.4       0.6        1.0
    0    32     0.0033            0.2       0.3       0.4       0.6        1.0
    2    36     0.0038            0.2       0.3       0.5       0.7        1.1
   -2    28     0.0036            0.2       0.3       0.5       0.7        1.0
   -2    28     0.0022            0.1       0.3       0.4       0.5        0.8
   -9    16     0.0020            0.1       0.2       0.3       0.5        0.8
| Table 4a. Thermal Noise, Central Image |
 |
ISO 1600
Exposure= 600 seconds
T= 33 C
Image Range:
-100.00 to 100.00 electrons about the mean
Central 500 x 300 pixel statistics:
min= 309 electrons
max= 769 electrons
mean= 350 electrons
standard deviation= 19.53 electrons |
 |
ISO 1600
Exposure= 600 seconds
T= 23 C
Image Range:
-100.00 to 100.00 electrons about the mean
Central 500 x 300 pixel statistics:
min= 314 electrons
max= 738 electrons
mean= 346 electrons
standard deviation= 9.67 electrons |
 |
ISO 1600
Exposure= 600 seconds
T= 19 C
Image Range:
-100.00 to 100.00 electrons about the mean
Central 500 x 300 pixel statistics:
min= 318 electrons
max= 691 electrons
mean= 344 electrons
standard deviation= 5.64 electrons |
 |
ISO 1600
Exposure= 600 seconds
T= 15 C
Image Range:
-100.00 to 100.00 electrons about the mean
Central 500 x 300 pixel statistics:
min= 314 electrons
max= 659 electrons
mean= 344 electrons
standard deviation= 4.40 electrons |
 |
ISO 1600
Exposure= 600 seconds
T= 12 C
Image Range:
-100.00 to 100.00 electrons about the mean
Central 500 x 300 pixel statistics:
min= 312 electrons
max= 653 electrons
mean= 344 electrons
standard deviation= 3.89 electrons |
 |
ISO 1600
Exposure= 600 seconds
T= 4 C
Image Range:
-100.00 to 100.00 electrons about the mean
Central 500 x 300 pixel statistics:
min= 311 electrons
max= 617 electrons
mean= 344 electrons
standard deviation= 3.27 electrons |
 |
ISO 1600
Exposure= 600 seconds
T= 0 C
Image Range:
-100.00 to 100.00 electrons about the mean
Central 500 x 300 pixel statistics:
min= 321 electrons
max= 613 electrons
mean= 344 electrons
standard deviation= 2.77 electrons |
 |
ISO 1600
Exposure= 600 seconds
T= -2 C
Image Range:
-100.00 to 100.00 electrons about the mean
Central 500 x 300 pixel statistics:
min= 317 electrons
max= 685 electrons
mean= 344 electrons
standard deviation= 2.82 electrons |
 |
ISO 1600
Exposure= 600 seconds
T= -9 C
Image Range:
-100.00 to 100.00 electrons about the mean
Central 500 x 300 pixel statistics:
min= 321 electrons
max= 605 electrons
mean= 344 electrons
standard deviation= 2.64 electrons |
| Table 4b. Thermal Noise, Full Image, sub-sampled |
 |
ISO 1600
Exposure= 600 seconds
T= 33 C
Image Range:
-100.00 to 100.00 electrons about the mean
Full image statistics:
min= 287 electrons
max= 2576 electrons
mean= 350 electrons
standard deviation= 21.39 electrons |
 |
ISO 1600
Exposure= 600 seconds
T= 23 C
Image Range:
-100.00 to 100.00 electrons about the mean
Full image statistics:
min= 297 electrons
max= 2050 electrons
mean= 346 electrons
standard deviation= 10.44 electrons |
 |
ISO 1600
Exposure= 600 seconds
T= 19 C
Image Range:
-100.00 to 100.00 electrons about the mean
Full image statistics:
min= 299 electrons
max= 2029 electrons
mean= 344 electrons
standard deviation= 6.21 electrons |
 |
ISO 1600
Exposure= 600 seconds
T= 15 C
Image Range:
-100.00 to 100.00 electrons about the mean
Full image statistics:
min= 299 electrons
max= 2018 electrons
mean= 344 electrons
standard deviation= 4.91 electrons |
 |
ISO 1600
Exposure= 600 seconds
T= 12 C
Image Range:
-100.00 to 100.00 electrons about the mean
Full image statistics:
min= 291 electrons
max= 2018 electrons
mean= 344 electrons
standard deviation= 4.90 electrons |
 |
ISO 1600
Exposure= 600 seconds
T= 12 C
Image Range:
-100.00 to 100.00 electrons about the mean
Full image statistics:
min= 299 electrons
max= 2017 electrons
mean= 344 electrons
standard deviation= 4.39 electrons |
 |
ISO 1600
Exposure= 600 seconds
T= 4 C
Image Range:
-100.00 to 100.00 electrons about the mean
Full image statistics:
min= 299 electrons
max= 2017 electrons
mean= 344 electrons
standard deviation= 3.80 electrons |
 |
ISO 1600
Exposure= 600 seconds
T= 0 C
Image Range:
-100.00 to 100.00 electrons about the mean
Full image statistics:
min= 300 electrons
max= 2543 electrons
mean= 344 electrons
standard deviation= 3.26 electrons |
 |
ISO 1600
Exposure= 600 seconds
T= -2 C
Image Range:
-100.00 to 100.00 electrons about the mean
Full image statistics:
min= 293 electrons
max= 2017 electrons
mean= 344 electrons
standard deviation= 3.11 electrons |
 |
ISO 1600
Exposure= 600 seconds
T= -9 C
Image Range:
-100.00 to 100.00 electrons about the mean
Full image statistics:
min= 295 electrons
max= 2016 electrons
mean= 344 electrons
standard deviation= 2.96 electrons |
| Table 4c. Thermal Noise, Full Image, sub-sampled |
|
ISO 1600
Exposure= 600 seconds
T= 33 C
Image Range:
-20.00 to 20.00 electrons about the mean
Full image statistics:
min= 287 electrons
max= 2576 electrons
mean= 350 electrons
standard deviation= 21.39 electrons |
|
ISO 1600
Exposure= 600 seconds
T= 19 C
Image Range:
-20.00 to 20.00 electrons about the mean
Full image statistics:
min= 299 electrons
max= 2029 electrons
mean= 344 electrons
standard deviation= 6.21 electrons |
|
ISO 1600
Exposure= 600 seconds
T= 12 C
Image Range:
-20.00 to 20.00 electrons about the mean
Full image statistics:
min= 291 electrons
max= 2018 electrons
mean= 344 electrons
standard deviation= 4.90 electrons |
|
ISO 1600
Exposure= 600 seconds
T= 4 C
Image Range:
-20.00 to 20.00 electrons about the mean
Full image statistics:
min= 299 electrons
max= 2017 electrons
mean= 344 electrons
standard deviation= 3.80 electrons |
|
ISO 1600
Exposure= 600 seconds
T= -9 C
Image Range:
-20.00 to 20.00 electrons about the mean
Full image statistics:
min= 295 electrons
max= 2016 electrons
mean= 344 electrons
standard deviation= 2.96 electrons |
Illustration of how much effect thermal dark current can have on long
exposure low light imaging is shown in Figure 4. The sky brightness was similar
for the two sessions to image the Pleiades star cluster. But the image made
by the 7D Mark II went much deeper with low apparent noise in faint nebulosity, whereas
the 7D1 image shows a lot of apparent noise in parts of the nebula that are brighter
and smoother with more detail in the 7D2 image. The 26 versus 25 minute exposure is only
a 4% difference in exposure time, so not a factor.
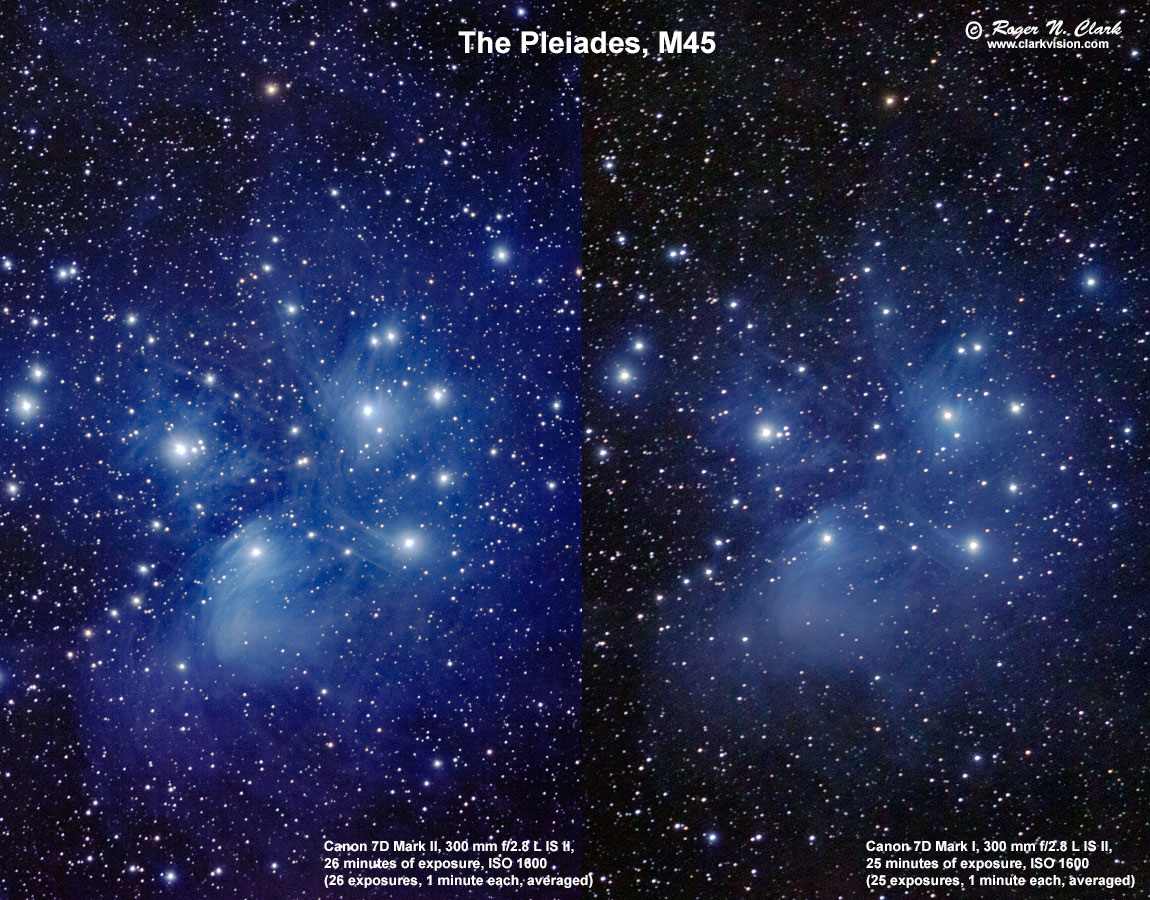
Figure 4. A comparison of long exposures on the Pleiades star cluster
showing faint blue reflection nebula. The sky conditions were very similar
for both images. The reason why the 7D2 recorded much more and fainter detail
is because of the lower dark current. See the full details of each
image
here for the 7D2 and
here for the 7D1.
See comparisons of dark frames from many cameras at:
Digital Cameras and Long Exposure Times:
Noise and Dark Current Comparisons ../long-exposure-comparisons/
Autofocus Tracking Setup
The 7D Mark II has a bewildering array of settings for tracking action.
Here is how I have set up my 7D Mark II camera. I do not claim these
are the only or best settings, only that based on my previous experience
photographing a lot of action, including African wildlife, Alaskan brown
bears and small fast birds at close range with a variety of cameras,
these settings are what I believe will produce good results and are working
well for me in my testing of the 7D Mark II so far.
Use Case 2:
Tracking sensitivity =0 (mid level)
Acceleration = 1 (mid level)
AF point auto switching = 1 (mid level)
Some like tracking sensitivity set to -1 (slow), which is fine for big
fast birds, but with my style and on small fast birds, I find tracking
sensitivity to mid or fast works better (I have lots of experience with
this on a 1D Mark IV).
Acceleration. If you only do birds in flight flying by you, this
is probably is not relevant. If you photograph birds taking off or
landing in the direction of the camera, then having acceleration at 1
or 2 is best. For small erratically flying birds, acceleration at
1 or 2 is probably best.
AF point switching is not relevant if you use only one AF point.
But if a large AF group, then see what the camera can do and set it to
1 or 2. It should work well with a bird against a blue sky. Canon also
shows/implies this will work with a bird flying against trees.
Some Negatives
Problem. The exposure scale on the right side in manual mode is very hard to see
in bright sunlight. The display is just not bright enough and I needed
to keep my eye in a very specific position to see the scale at all. This
is a real problem in the heat of action. It is also a larger problem if
wearing sunglasses. I find this unacceptable and Canon needs to address
the issue and if they can't fix it, add an option to keep the scale on
the bottom in all modes. This was written Nov. 7, 2014. It is still a
problem in November 2015. I have made over 13,000 images with the 7D2 now, and
it is a pain to confirm exposure with this scale, taking time away from
concentrating on the action. No Solution.
Problem. The second problem that is a problem for me is the location of the
magnify scale (SOLUTION BELOW). On all other Canon cameras that I have used/remember,
the magnify button can be enabled by one's right hand. The 7D2
has the button on the left, so if I am reviewing images and I want to
check focus, I need to use two hands or in a cumbersome
move, take my right hand off the camera and move it over to push the
button on the left side of the camera. This is a problem in (at least)
two situations: hand holding a large telephoto when doing action
photography (I need my left hand to hold the lens). 2) Night
photography when cold and wearing gloves it is hard to feel the button
with gloves on, and taking both gloves off when is it cold just to
check exposures is certainly not ideal. The 6D has a much better
design for reviewing images with one hand (and actually with just one thumb).
Solution.several people emailed me when I first posted the review,
and noted the solution: program the "set" button in the center of the wheel
to display and magnify the image. A second press of the button sets the view to
the full image. Moving the wheel by the shutter button changes the magnification.
I used this on my February 2015 African safari and it works like a charm.
Minor Problem. On a cold night of astrophotography (temperatures a little below
freezing) where the camera is continually making exposures, I ran
through two batteries per night. With the larger batteries of my 1D Mark IV,
one battery would last all night. But 2 batteries for the 7D Mark II
still weight less than one 1DIV battery. Just be prepared and carry
multiple batteries. On Safari, where I made about 12,000 images in
16 days with the 7D2, I constantly needed to change batteries, at least once a day.
I carried 4 batteries, so it was not a problem, but I had to be sure
I had at least 2 fully charged spare batteries each day.
Conclusions
The data shown here for the Canon 7D Mark II indicate that the camera
is operating at near perfect levels for the sensor with lower apparent
read noise and impressively low pattern noise compared to all other
current Canon cameras tested and better than that in the 7D Mark I.
This means that for high signals, noise is dominated by photon statistics.
Sensitivity is improved 14% over the 7D Mark 1, and the sensitivity per
square micron is the highest that I have measured for any Canon camera
to date.
The approximately 10x lower thermal dark current is a game changing
factor, making this camera the top Canon camera for long exposure low light
photography that I have tested. The superb autofocus system, comparable to Canon
1D series pro cameras with 65 autofocus points is another game changing
innovation, as the camera is at a price point that is affordable to more
people. The 7D Mark II was my action camera of choice for my February 2015
Tanzanian safari where I obtained about 12,000 images with the 7D2. See my
Africa 2015 Image Gallery for examples.
Between improving sensitivity and pushing the noise floor lower, the 7D Mark II
provides better dynamic range, better apparent noise, and ability to lift
shadow detail much better than its predecessor.
Another factor for astrophotographers is the sensitivity to red
hydrogen-alpha light. The image of the Horsehead nebula above
illustrates quite respectable hydrogen alpha sensitivity. The hydrogen
alpha signal stood out in single 1-minute frames much better than
images made with the 7D Mark 1 that were obtained under darker skies.
Astrophotographers may not feel a need to have this camera modified
to improve the hydrogen-alpha response. This could be another game
changer. Personally, I prefer unmodified cameras with standard RGB
response as the colors better distinguish between processes recorded in
the night sky. For example, the Horsehead nebula shows as pink in the 7D
Mark II image while the surrounding nebulosity is more reddish-orange.
The reddish orange color indicates the source is mainly due to dust as
opposed to emission by gaseous hydrogen. Modified DSLRs show both these
as very red and it is difficult to separate the processes. The 7D Mark
II appears to provide a nice balance between red hydrogen-alpha response
while still maintaining good color balance. This, in my opinion, makes
night sky photos more colorful and interesting.
The small pixel size of the 7D2 actually helps record fainter stars,
contrary to prevailing views of larger pixels are more sensitive. A star
image is a point source plus sky background. A smaller pixel sees a
smaller area of sky so the sky background contributes less signal to
the star image, providing better contrast of faint stars against the sky.
Smaller pixels also provide more contrast in the fine details ON THE
SUBJECT in people, wildlife, landscape and other photos (astrophotos
too). Some digital photographers focus on the noise and the pixel.
Photographers should focus on the SUBJECT.
Note that despite a smaller pixel size compared to the 7D Mark I,
the full well capacity is larger on the 7D Mark II.
For comparison with other cameras, see
Digital Sensor Performance Summary (the 7D Mark II data will
be added to that page soon, but until then you can use the parameters in Table
1 to see where the data will fall in comparison to other cameras).
To illustrate pulling up shadows/low end, examine the full size
Horsehead nebula 7D Mark II image.
The faintest signals were less than 1 photon per minute! Those faint signals were magnified more extreme than
anyone would every push shadows in a wildlife or landscape scene. There is no visible banding. If I did this on
a 7D mark 1, the result would not be pretty.
Indeed, this image with a 7D1 of the same subject made in much darker skies and stretched less shows banding:
Horsehead nebula 7D Mark 1 image.
Look along the bottom 1/4 of the image from center to the right. Note the vertical banding pattern in the faint
red background of the 7D Mark 1 image. Compare with the 7D2 image above.
Final Comments
I am very impressed with this camera, so much so, that it is now my preferred camera
for night imaging except when I need wider angles, then I'll use my Canon 6D, the next best
low light camera in the Canon lineup. I'll also use the 7D Mark II for all my action photography.
That makes the 7D Mark II an amazing all-around camera, from sports and wildlife action to
night photography.
Canon 7D Mark II Image Gallery
If you find the information on this site useful and wish to purchase the equipment
that I use to make images, please use
the links to B&H Photo to make the purchases. By using the link, you will help support
clarkvision.com at no additional cost to you. I have used B&H Photo for decades and
have always had a great experience and their prices are very good.
Please support Clarkvision; make a donation (link below).
Click here to go to B&H Photo and Purchase the Canon EOS 7D Mark II DSLR Camera.
Appendix 1
                      Table A1:  ISO 100 Sensor Data and Analysis

Offset= 2048
Model gain = 2.74 e/DN
Model read noise = 15.  electrons

         Observed Observed Observed
          min-o   max-o   mean-o    2-img std    noise     S/N      signal      ISO  relative    S/N     S/N
    file  (DN)    (DN)    (DN)        (DN)       (DN)            (electrons)         exposure    model obs/model

0J6A0104  9009.00  9648.00  9300.40    82.24      58.16    159.92    25575.5    100  0.250000    158.9     1.01
0J6A0105  8980.00  9599.00  9267.09    82.24      58.16    159.35    25392.6    100  0.250000    158.6     1.01
0J6A0106  7092.00  7654.00  7351.88    73.72      52.13    141.03    19889.9    100  0.192308    141.1     1.00
0J6A0107  7139.00  7684.00  7390.96    73.72      52.13    141.78    20101.9    100  0.192308    141.5     1.00
0J6A0108  5681.00  6174.00  5910.74    65.71      46.46    127.21    16183.0    100  0.161290    126.4     1.01
0J6A0109  5613.00  6034.00  5826.20    65.71      46.46    125.39    15723.4    100  0.161290    125.5     1.01
0J6A0110  4435.00  4832.00  4630.71    58.95      41.68    111.10    12342.7    100  0.125000    111.7     0.99
0J6A0111  4445.00  4862.00  4644.66    58.95      41.68    111.43    12417.2    100  0.125000    111.8     0.99
0J6A0112  3483.00  3808.00  3645.51    52.43      37.07     98.33     9668.8    100  0.096154     98.8     0.99
0J6A0113  3423.00  3790.00  3630.88    52.43      37.07     97.94     9591.4    100  0.096154     98.6     1.00
0J6A0114  2709.00  3010.00  2855.41    46.37      32.79     87.09     7584.1    100  0.081301     87.2     1.00
0J6A0115  2730.00  3023.00  2874.53    46.37      32.79     87.67     7686.0    100  0.081301     87.5     1.00
0J6A0116  2134.00  2392.00  2265.96    41.49      29.34     77.24     5965.7    100  0.062500     77.4     1.00
0J6A0117  2162.00  2430.00  2299.82    41.49      29.34     78.39     6145.3    100  0.062500     78.0     0.99
0J6A0118  1680.00  1913.00  1804.45    36.88      26.08     69.18     4786.6    100  0.048309     68.8     1.01
0J6A0119  1706.00  1927.00  1814.55    36.88      26.08     69.57     4840.3    100  0.048309     69.0     1.00
0J6A0120  1337.00  1541.00  1446.35    33.04      23.36     61.91     3832.5    100  0.040486     61.2     1.01
0J6A0121  1337.00  1552.00  1441.08    33.04      23.36     61.68     3804.7    100  0.040486     61.1     1.01
0J6A0122  1035.00  1210.00  1123.39    29.39      20.78     54.06     2922.4    100  0.031250     53.6     1.01
0J6A0123  1045.00  1226.00  1132.60    29.39      20.78     54.50     2970.5    100  0.031250     53.8     1.00
0J6A0124   827.00   995.00   905.10    26.55      18.77     48.22     2324.9    100  0.024096     47.7     1.01
0J6A0125   819.00   973.00   895.22    26.55      18.77     47.69     2274.4    100  0.024096     47.4     1.02
0J6A0126   645.00   782.00   709.72    23.68      16.74     42.39     1796.6    100  0.020243     41.7     1.02
0J6A0127   649.00   801.00   723.54    23.68      16.74     43.21     1867.2    100  0.020243     42.2     1.00
0J6A0128   499.00   628.00   558.38    21.40      15.13     36.91     1362.0    100  0.015625     36.5     1.01
0J6A0129   512.00   640.00   574.30    21.40      15.13     37.96     1440.8    100  0.015625     37.1     0.99
0J6A0130   395.00   511.00   453.84    19.61      13.87     32.73     1071.3    100  0.012048     32.5     1.01
0J6A0131   398.00   514.00   457.16    19.61      13.87     32.97     1087.1    100  0.012048     32.6     1.00
0J6A0132   296.00   410.00   352.55    17.57      12.43     28.37      805.1    100  0.010132     28.0     1.01
0J6A0133   306.00   415.00   356.71    17.57      12.43     28.71      824.2    100  0.010132     28.2     1.01
0J6A0134   236.00   333.00   282.08    15.97      11.29     24.98      623.8    100  0.007812     24.5     1.02
0J6A0135   229.00   324.00   275.69    15.97      11.29     24.41      595.9    100  0.007812     24.1     1.04
0J6A0136   189.00   272.00   229.99    14.88      10.53     21.85      477.5    100  0.006024     21.5     1.01
0J6A0137   178.00   266.00   225.50    14.88      10.53     21.42      459.0    100  0.006024     21.3     1.03
0J6A0138   133.00   214.00   170.33    13.52       9.56     17.82      317.5    100  0.005066     17.7     1.00
0J6A0139   140.00   219.00   180.28    13.52       9.56     18.86      355.6    100  0.005066     18.4     0.97
0J6A0140   112.00   187.00   148.85    12.57       8.89     16.74      280.4    100  0.003906     16.2     1.03
0J6A0141   107.00   174.00   139.67    12.57       8.89     15.71      246.8    100  0.003906     15.5     1.08
0J6A0142    88.00   153.00   120.17    11.87       8.40     14.31      204.8    100  0.003012     14.0     1.02
0J6A0143    75.00   151.00   109.55    11.87       8.40     13.05      170.2    100  0.003012     13.1     1.09
0J6A0144    55.00   115.00    82.99    10.88       7.69     10.79      116.4    100  0.002533     10.7     1.01
0J6A0145    61.00   121.00    90.84    10.88       7.69     11.81      139.5    100  0.002533     11.4     0.94
0J6A0146    41.00   107.00    70.77    10.53       7.45      9.50       90.3    100  0.001953      9.5     1.00
0J6A0147    46.00   108.00    75.58    10.53       7.45     10.15      103.0    100  0.001953     10.0     0.95
0J6A0148    24.00    87.00    53.29     9.84       6.96      7.66       58.7    100  0.001506      7.6     1.01
0J6A0149    25.00    83.00    53.86     9.84       6.96      7.74       60.0    100  0.001506      7.6     1.00
0J6A0150    20.00    90.00    46.29     9.49       6.71      6.90       47.6    100  0.001266      6.8     1.02
0J6A0151    16.00    74.00    43.03     9.49       6.71      6.41       41.1    100  0.001266      6.4     1.08
0J6A0152    11.00    62.00    37.39     9.14       6.47      5.78       33.5    100  0.000977      5.7     1.02
0J6A0153     7.00    63.00    36.38     9.14       6.47      5.63       31.7    100  0.000977      5.5     1.05
0J6A0154     4.00    55.00    29.77     9.01       6.37      4.68       21.9    100  0.000753      4.7     1.00
0J6A0155     2.00    56.00    28.43     9.01       6.37      4.46       19.9    100  0.000753      4.5     1.04
0J6A0156    -3.00    46.00    23.82     8.79       6.21      3.83       14.7    100  0.000633      3.8     1.00
0J6A0157    -4.00    48.00    21.25     8.79       6.21      3.42       11.7    100  0.000633      3.5     1.11
0J6A0158   -12.00    43.00    17.34     8.46       5.98      2.90        8.4    100  0.000488      2.9     1.01
0J6A0159    -8.00    45.00    17.32     8.46       5.98      2.89        8.4    100  0.000488      2.9     1.01
0J6A0160    -6.00    41.00    15.84     8.42       5.95      2.66        7.1    100  0.000377      2.6     1.00
0J6A0161   -12.00    40.00    14.11     8.42       5.95      2.37        5.6    100  0.000377      2.4     1.12
0J6A0162   -13.00    41.00    12.65     8.33       5.89      2.15        4.6    100  0.000317      2.2     1.00
0J6A0163   -14.00    36.00    11.25     8.33       5.89      1.91        3.6    100  0.000317      1.9     1.11
0J6A0164   -20.00    46.00     8.42     8.15       5.76      1.46        2.1    100  0.000244      1.5     1.00
0J6A0165   -16.00    44.00     9.57     8.15       5.76      1.66        2.8    100  0.000244      1.7     0.88
0J6A0166   -16.00    35.00     7.97     8.18       5.78      1.38        1.9    100  0.000188      1.4     0.99
0J6A0167   -20.00    30.00     6.77     8.18       5.78      1.17        1.4    100  0.000188      1.2     1.16
0J6A0168   -18.00    34.00     5.48     8.02       5.67      0.97        0.9    100  0.000158      1.0     1.00
0J6A0169   -19.00    30.00     5.52     8.02       5.67      0.97        0.9    100  0.000158      1.0     0.99
0J6A0170   -18.00    29.00     5.04     8.03       5.68      0.89        0.8    100  0.000122      0.9     0.99
0J6A0171   -16.00    29.00     4.48     8.03       5.68      0.79        0.6    100  0.000122      0.8     1.12
References
Alarcon et. al., 2023, Scientific CMOS Sensors in Astronomy: IMX455 and IMX411
Publications of the Astronomical Society of the Pacific 135:055001 (15pp).
https://doi.org/10.1088/1538-3873/acd04a
direct link to pdf
Notes:
DN is "Data Number." That is the number in the file for each
pixel. I'm quoting the luminance level (although red, green
and blue are almost the same in the cases I cited).
16-bit signed integer: -32768 to +32767
16-bit unsigned integer: 0 to 65535
Photoshop uses signed integers, but the 16-bit tiff is
unsigned integer (correctly read by ImagesPlus).
Procedures for performing this analysis are described in:
Procedures for Evaluating Digital Camera Noise, Dynamic Range, and Full
Well Capacities; Canon 1D Mark II Analysis
Disclosure
Roger Clark is a B&H Photo affiliate. The affiliate links to a product
simply allow the ability to buy the product for the same price as if the purchase was made through
B&H directly. By using the link you support this site and enable it to
remain active with new reviews and information. Please support this site.