The Canon 7D Digital Camera Review:
Sensor Noise, Thermal Noise, Dynamic Range, and Full Well Analysis
by Roger N. Clark
All images, text and data on this site are copyrighted.
They may not be used except by written permission from Roger N. Clark.
All rights reserved.
If you find the information on this site useful,
please support Clarkvision and make a donation (link below).
This page shows an analysis of noise, dynamic range, and full well capacity
of a Canon 7D camera.
It also shows the dark current and noise from thermal
dark current as a function of temperature.
Procedures for performing this analysis are described in:
Procedures for Evaluating Digital Camera Noise, Dynamic Range, and Full
Well Capacities; Canon 1D Mark II Analysis
The lowest possible noise from a
system detecting light is the noise due to Poisson statistics
from the random rate of the arrival of photons. This is called
photon statistics, or photon noise. Noise from the electronics
will add to the photon noise.
Noise in Canon 7D images is limited by photon statistics at high
signal levels and by electronic noise from reading the sensor
(called readout noise) and noise from the downstream electronics at very low signal levels.
In the case of high signal levels, a system that is photon statistics
limited enables us to directly measure how many photons
the sensor captures, and by increasing the exposure, we can
determine how many photons are required to saturate the
sensor. That is called the full well capacity, or simply, maximum signal capacity.
With data on the lowest noise to the highest signal, we can then
determine the dynamic range of the sensor.
Results: Canon 7D sensor analysis
             Table 1
-------------------------------------------------
              Apparent  Maximum     Measured
 ISO  Gain   Read Noise  signal    Dynamic range
      e/DN  (electrons) (electrons)   stops

  100  2.15     12.1     24800        11.0
  200  1.23      7.6     16300        11.1
  400  0.61      4.9      8150        10.7
  800  0.31      3.8      4080        10.1
 1600  0.15      3.0      2040         9.4
 3200  0.077     2.7      1020         8.6
 6400  0.038    ~2.7       510         7.6

Pixel pitch: 4.3 microns.
18 megapixels.
S/N on 18% gray card, ISO 100 = 67.
Sensor Full Well Capacity at lowest ISO: 24,800 electrons.
Sensor dynamic range = 24800/2.7 =  9,185 = 13.2 stops.
ISO at unity gain (scaled to 12 bit) =  984 (14-bit unity gain = ISO 246).
Low Light sensitivity Factor: 364.
Apparent Image Quality, AIQ = 60.
-------------------------------------------------
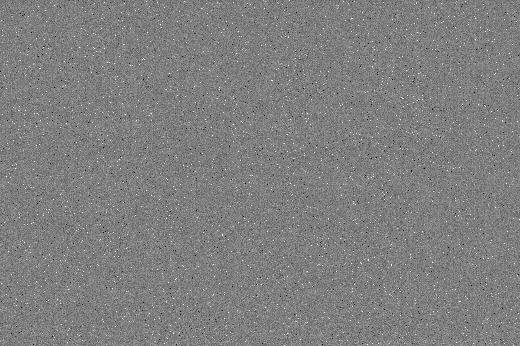
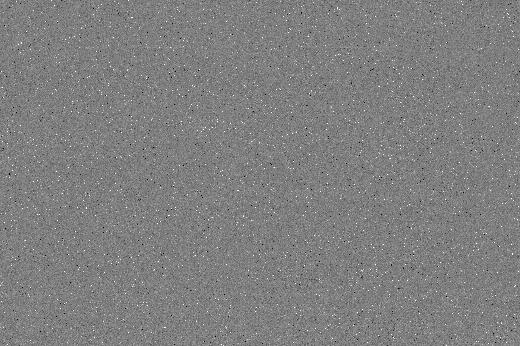
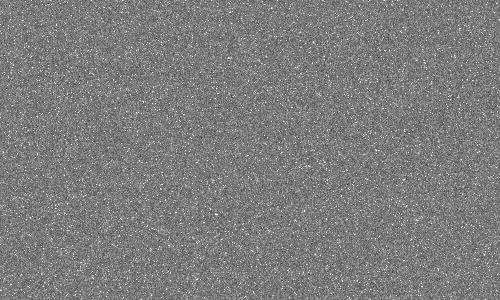
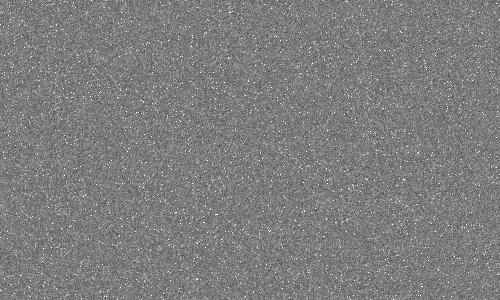
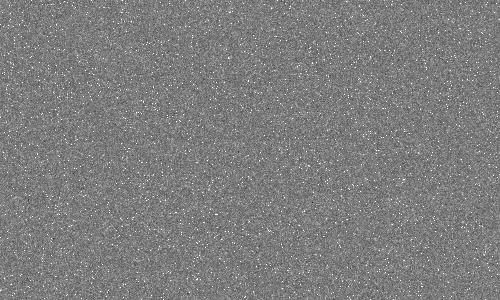
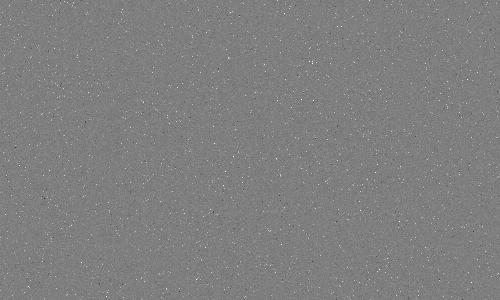
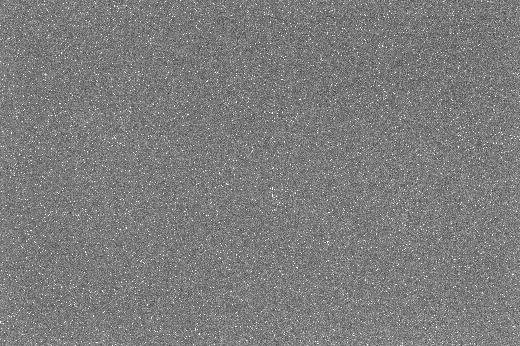
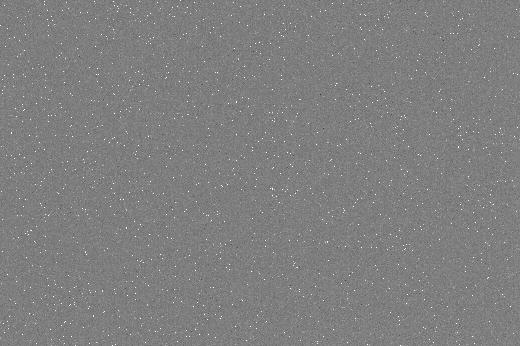
Fixed Pattern (Banding) Noise
Table 2 shows the noise as a function of ISO in image form. The images
illustrate several things: 1) lower banding noise at higher ISOs. 2)
Better detection of smaller signals at higher ISOs (the random noise
decreases). 3) At a certain high ISO, improvements decrease, meaning
there is no benefit to higher ISO. Note, ISO is a post sensor gain
and does not increase sensitivity. Increasing ISO digitizes a smaller
range (see Table 1) but does improve the noise floor up to a point.
For night and low light photography, ISO 1600 produces excellent results.
The 7D camera has lower fixed pattern noise at ISOs less than 800 than
many other Canon cameras tested, including the Canon 1DX, but falls way
below the new Canon 7D2.
| Table 2a. Apparent Read Noise, Central Image |
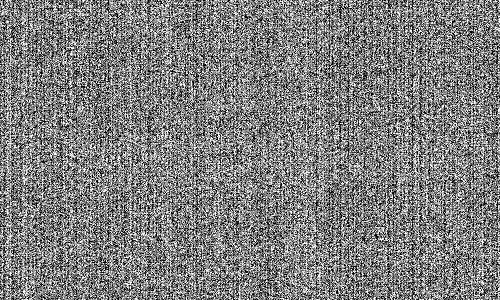 | ISO 100
Image Range:
-20.00 to 20.00 electrons about the mean
Central 500 x 300 pixel statistics:
min= 4343 electrons
max= 4474 electrons
mean= 4404 electrons
standard deviation= 12.35 electrons |
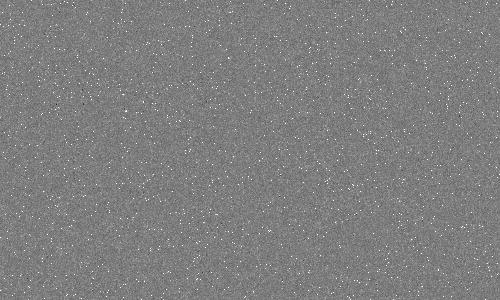
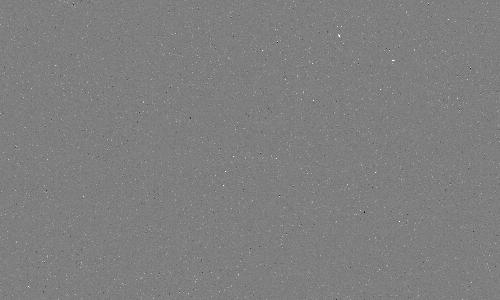
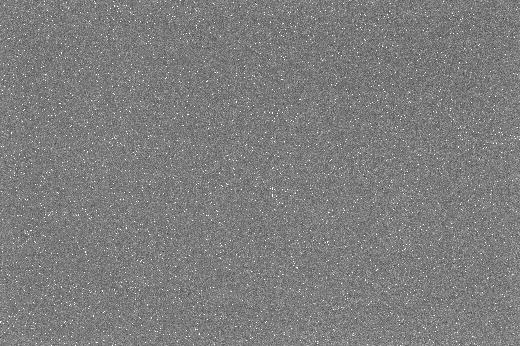
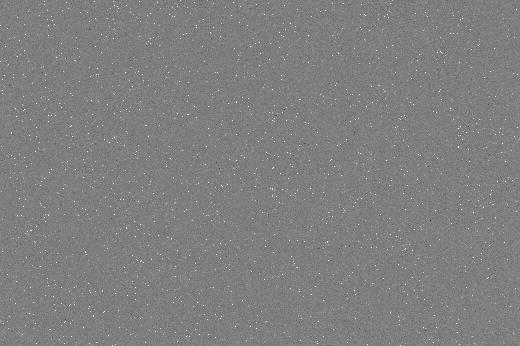
 | ISO 200
Image Range:
-20.00 to 20.00 electrons about the mean
Central 500 x 300 pixel statistics:
min= 2451 electrons
max= 2590 electrons
mean= 2519 electrons
standard deviation= 7.68 electrons |
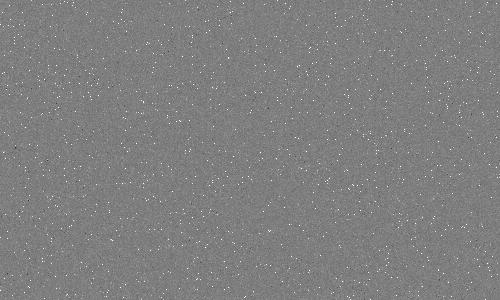
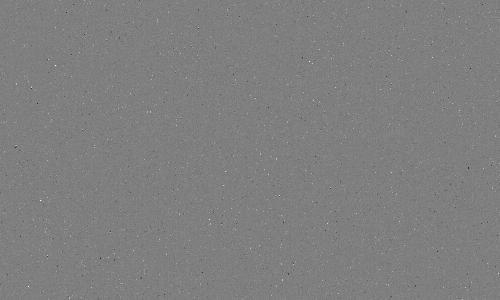
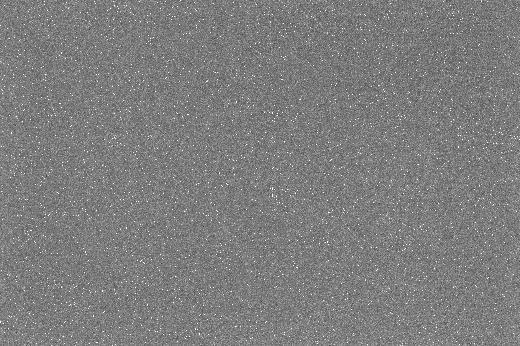
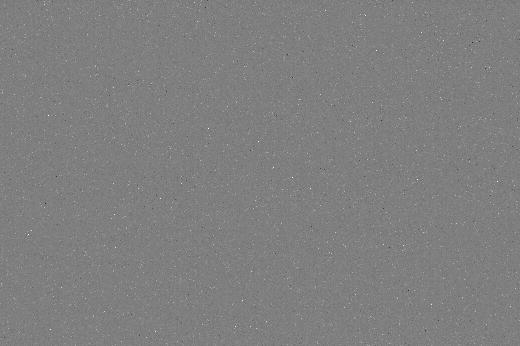
 | ISO 400
Image Range:
-20.00 to 20.00 electrons about the mean
Central 500 x 300 pixel statistics:
min= 1190 electrons
max= 1316 electrons
mean= 1249 electrons
standard deviation= 4.94 electrons |
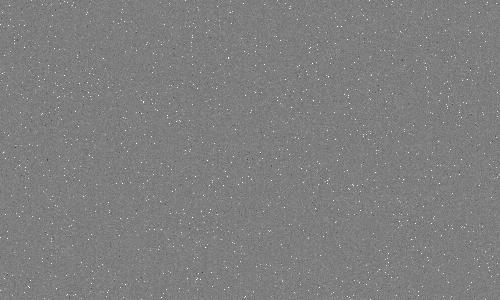
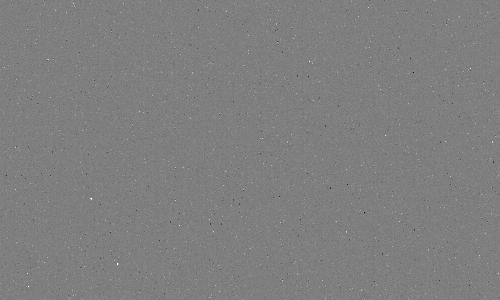
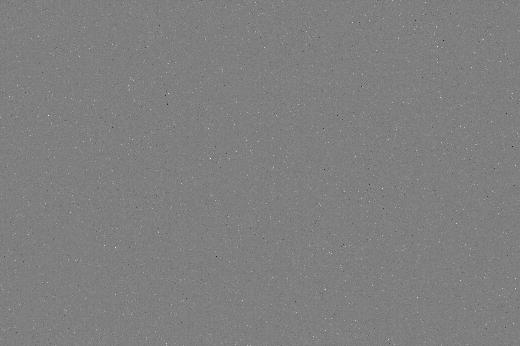
 | ISO 800
Image Range:
-20.00 to 20.00 electrons about the mean
Central 500 x 300 pixel statistics:
min= 569 electrons
max= 712 electrons
mean= 635 electrons
standard deviation= 3.85 electrons |
 | ISO 1600
Image Range:
-20.00 to 20.00 electrons about the mean
Central 500 x 300 pixel statistics:
min= 245 electrons
max= 377 electrons
mean= 307 electrons
standard deviation= 3.07 electrons |
 | ISO 3200
Image Range:
-20.00 to 20.00 electrons about the mean
Central 500 x 300 pixel statistics:
min= 106 electrons
max= 218 electrons
mean= 158 electrons
standard deviation= 2.87 electrons |
| Table 2b. Apparent Read Noise, Full Image, sub-sampled |
 | ISO 100
Image Range:
-20.00 to 20.00 electrons about the mean
Full image statistics:
min= 4304 electrons
max= 4513 electrons
mean= 4404 electrons
standard deviation= 12.29 electrons |
 | ISO 200
Image Range:
-20.00 to 20.00 electrons about the mean
Full image statistics:
min= 2417 electrons
max= 2621 electrons
mean= 2520 electrons
standard deviation= 7.60 electrons |
 | ISO 400
Image Range:
-20.00 to 20.00 electrons about the mean
Full image statistics:
min= 1144 electrons
max= 1344 electrons
mean= 1249 electrons
standard deviation= 4.92 electrons |
 | ISO 800
Image Range:
-20.00 to 20.00 electrons about the mean
Full image statistics:
min= 540 electrons
max= 737 electrons
mean= 635 electrons
standard deviation= 3.79 electrons |
 | ISO 1600
Image Range:
-20.00 to 20.00 electrons about the mean
Full image statistics:
min= 217 electrons
max= 399 electrons
mean= 307 electrons
standard deviation= 3.08 electrons |
 | ISO 3200
Image Range:
-20.00 to 20.00 electrons about the mean
Full image statistics:
min= 83 electrons
max= 237 electrons
mean= 158 electrons
standard deviation= 2.82 electrons |
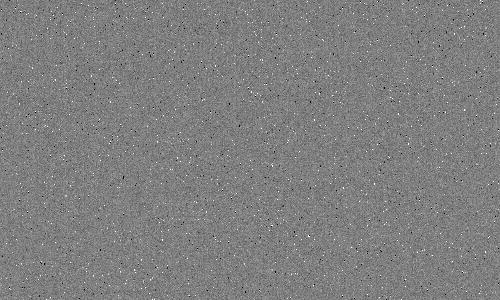
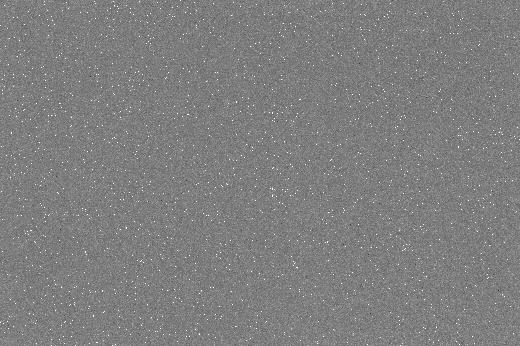
Dark Current and Thermal Noise
On long exposures, electrons collect in the sensor due to thermal
processes. This is called the thermal dark current. As with photon noise,
the noise from thermal dark current is the square root of the
signal. One can subtract the dark current level, but not the noise
from the dark current. Many modern digital cameras have on sensor
dark current suppression, but this does not suppress the noise
from the dark current. It does, however, prevent uneven
zero levels that plagues cameras before the innovation (Canon
cameras before circa 2008). Examples of this problem are seen
at:
Long-Exposure Comparisons.
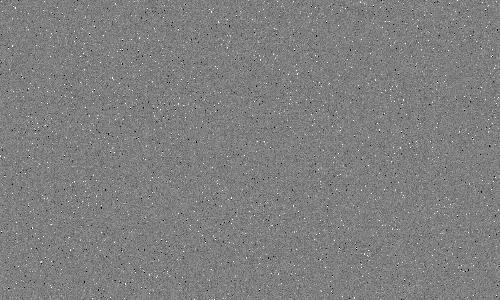
The dark versus temperature for the Canon 7D is shown in Table 3.
The uniformity of the 7D long exposure dark frames, Tables 4a, 4b, 3c
is outstanding. There is no noticeable banding, enabling multiple
frames to be averaged, or very long exposures to be made without
annoying pattern noise. Thermal noise ultimately limits the weakest
signals that can be detected. Thermal dark current is very
temperature dependent, so only compare these values to other sensors made
at the same temperature.
The dark current increased 25 times in the 7D from 3 to 22 degrees C
or doubling about every 4.25 degrees C on average. Note too that the
lower the temperature, the fewer hot pixels show in the image.
This makes long expoure night imaging difficult in hot environments,
but this is true of all uncooled digital cameras.
                              Table 3
           Canon 7D Dark Current and Noise vs Temperature

                                     Noise from Dark Current in Electrons
 Temperature   Dark current            versus  Exposure Time (seconds)
  (C)   (F)   electrons/sec.    10 sec    30 sec    60 sec    120 sec    300 sec

   22    72     1.856             4.3       7.5      10.6      14.9       23.6
   22    72     1.801             4.2       7.3      10.4      14.7       23.2
   19    66     1.216             3.5       6.0       8.5      12.1       19.1
   19    66     1.298             3.6       6.2       8.8      12.5       19.7
   19    66     1.335             3.7       6.3       8.9      12.7       20.0
   14    57     0.540             2.3       4.0       5.7       8.0       12.7
   14    57     0.508             2.3       3.9       5.5       7.8       12.3
   10    50     0.161             1.3       2.2       3.1       4.4        6.9
    9    48     0.118             1.1       1.9       2.7       3.8        5.9
    7    45     0.106             1.0       1.8       2.5       3.6        5.6
    3    37     0.077             0.9       1.5       2.1       3.0        4.8
    3    37     0.072             0.8       1.5       2.1       2.9        4.6
    3    37     0.080             0.9       1.5       2.2       3.1        4.9
    2    36     0.095             1.0       1.7       2.4       3.4        5.3
   -4    25     0.045             0.7       1.2       1.6       2.3        3.7
   -4    25     0.045             0.7       1.2       1.6       2.3        3.7
  -10    14     0.024             0.5       0.9       1.2       1.7        2.7
  -11    12     0.045             0.7       1.2       1.6       2.3        3.7
| Table 4a. Thermal Noise, Central Image |
 |
ISO 1600
Exposure= 601 seconds
T= 22 C
Image Range:
-100.00 to 100.00 electrons about the mean
Central 500 x 300 pixel statistics:
min= 238 electrons
max= 2175 electrons
mean= 311 electrons
standard deviation= 33.03 electrons |
 |
ISO 1600
Exposure= 601 seconds
T= 19 C
Image Range:
-100.00 to 100.00 electrons about the mean
Central 500 x 300 pixel statistics:
min= 242 electrons
max= 1777 electrons
mean= 310 electrons
standard deviation= 28.09 electrons |
 |
ISO 1600
Exposure= 601 seconds
T= 19 C
Image Range:
-100.00 to 100.00 electrons about the mean
Central 500 x 300 pixel statistics:
min= 234 electrons
max= 1731 electrons
mean= 310 electrons
standard deviation= 28.48 electrons |
 |
ISO 1600
Exposure= 601 seconds
T= 14 C
Image Range:
-100.00 to 100.00 electrons about the mean
Central 500 x 300 pixel statistics:
min= 233 electrons
max= 1565 electrons
mean= 309 electrons
standard deviation= 17.73 electrons |
 |
ISO 1600
Exposure= 601 seconds
T= 10 C
Image Range:
-100.00 to 100.00 electrons about the mean
Central 500 x 300 pixel statistics:
min= 244 electrons
max= 1405 electrons
mean= 308 electrons
standard deviation= 10.27 electrons |
 |
ISO 1600
Exposure= 601 seconds
T= 9 C
Image Range:
-100.00 to 100.00 electrons about the mean
Central 500 x 300 pixel statistics:
min= 244 electrons
max= 1401 electrons
mean= 308 electrons
standard deviation= 8.92 electrons |
 |
ISO 1600
Exposure= 601 seconds
T= 3 C
Image Range:
-100.00 to 100.00 electrons about the mean
Central 500 x 300 pixel statistics:
min= 237 electrons
max= 1385 electrons
mean= 308 electrons
standard deviation= 7.21 electrons |
 |
ISO 1600
Exposure= 601 seconds
T= -4 C
Image Range:
-100.00 to 100.00 electrons about the mean
Central 500 x 300 pixel statistics:
min= 213 electrons
max= 1292 electrons
mean= 308 electrons
standard deviation= 5.99 electrons |
 |
ISO 1600
Exposure= 601 seconds
T= -10 C
Image Range:
-100.00 to 100.00 electrons about the mean
Central 500 x 300 pixel statistics:
min= 235 electrons
max= 1144 electrons
mean= 308 electrons
standard deviation= 4.86 electrons |
 |
ISO 1600
Exposure= 601 seconds
T= -11 C
Image Range:
-100.00 to 100.00 electrons about the mean
Central 500 x 300 pixel statistics:
min= 215 electrons
max= 1687 electrons
mean= 308 electrons
standard deviation= 6.00 electrons |
| Table 4b. Thermal Noise, Full Image, sub-sampled |
 |
ISO 1600
Exposure= 601 seconds
T= 22 C
Image Range:
-100.00 to 100.00 electrons about the mean
Full image statistics:
min= 192 electrons
max= 2379 electrons
mean= 310 electrons
standard deviation= 32.88 electrons |
 |
ISO 1600
Exposure= 601 seconds
T= 19 C
Image Range:
-100.00 to 100.00 electrons about the mean
Full image statistics:
min= 202 electrons
max= 2378 electrons
mean= 310 electrons
standard deviation= 28.14 electrons |
 |
ISO 1600
Exposure= 601 seconds
T= 19 C
Image Range:
-100.00 to 100.00 electrons about the mean
Full image statistics:
min= 192 electrons
max= 2457 electrons
mean= 309 electrons
standard deviation= 28.58 electrons |
 |
ISO 1600
Exposure= 601 seconds
T= 14 C
Image Range:
-100.00 to 100.00 electrons about the mean
Full image statistics:
min= 202 electrons
max= 2457 electrons
mean= 309 electrons
standard deviation= 17.92 electrons |
 |
ISO 1600
Exposure= 601 seconds
T= 10 C
Image Range:
-100.00 to 100.00 electrons about the mean
Full image statistics:
min= 200 electrons
max= 2375 electrons
mean= 308 electrons
standard deviation= 10.87 electrons |
 |
ISO 1600
Exposure= 601 seconds
T= 9 C
Image Range:
-100.00 to 100.00 electrons about the mean
Full image statistics:
min= 207 electrons
max= 2375 electrons
mean= 308 electrons
standard deviation= 9.76 electrons |
 |
ISO 1600
Exposure= 601 seconds
T= -4 C
Image Range:
-100.00 to 100.00 electrons about the mean
Full image statistics:
min= 203 electrons
max= 2457 electrons
mean= 308 electrons
standard deviation= 6.84 electrons |
 |
ISO 1600
Exposure= 601 seconds
T= -10 C
Image Range:
-100.00 to 100.00 electrons about the mean
Full image statistics:
min= 172 electrons
max= 2457 electrons
mean= 308 electrons
standard deviation= 6.53 electrons |
 |
ISO 1600
Exposure= 601 seconds
T= -11 C
Image Range:
-100.00 to 100.00 electrons about the mean
Full image statistics:
min= 192 electrons
max= 2457 electrons
mean= 308 electrons
standard deviation= 6.35 electrons |
| Table 4c. Thermal Noise, Full Image, sub-sampled |
 |
ISO 1600
Exposure= 601 seconds
T= -4 C
Image Range:
-20.00 to 20.00 electrons about the mean
Full image statistics:
min= 203 electrons
max= 2457 electrons
mean= 308 electrons
standard deviation= 6.84 electrons |
See comparisons of dark frames from many cameras at:
Digital Cameras and Long Exposure Times:
Noise and Dark Current Comparisons ../long-exposure-comparisons/
Conclusions
The data shown here for the Canon 7D shows that the camera is
operating at near perfect levels for the sensor. This means that for
high signals, noise is dominated by photon statistics. The model assumes
photon noise and a noise floor given by the read noise value. The model
predicts the observed data to within a few percent, proving the camera
is photon noise limited over most of its range. Noise at low
signal levels is very good, among the lowest cameras measured.
There is evidence that Canon has improved the fill factor as claimed
in press reports, but on a pixel level, this is offset by the smaller
pixel area. To achieve higher
signal-to-noise ratio images, a higher quantum efficiency sensor with
a larger full well would be needed. Without increasing the full well
capacity, the maximum signal-to-noise ratio would not improve.
Improvements in quantum
efficiency of about 2 to 3 are possible (Reference 2), but currently that
would require much more expensive detectors, such as back-side
illuminated CCD or CMOS sensors. Note some DSLRs have maximum full well capacities
on the order of 50,000 electrons (e.g. Canon 20D) to 80,000
electrons (e.g. Canon 1D Mark II), so the Canon 7D is on the low
end of full well capacity, as is expected from its small pixel size.
For comparison with a larger pixel DSLR, compare to the Tables and
graphs in
Digital Sensor Performance Summary.
The constant dark level with long exposure time indicates the
camera has on-sensor dark current suppression. This, however, does
not suppress noise from dark current. But it results in a uniformly
dark level that needs no post processing correction. No long exposure
dark frames are needed when making long exposures if recording raw.
If you find the information on this site useful,
please support Clarkvision and make a donation (link below).
Appendix 1
                      Table A1:  ISO 100 Sensor Data and Analysis

Offset= 2048
Model gain = 2.15 e/DN
Model read noise = 12.2 electrons

         Observed Observed Observed
            min     max     mean     2-img std    noise     S/N      signal     ISO  relative    S/N     S/N
    file    (DN)    (DN)    (DN)       (DN)       (DN)            (electrons)        exposure    model obs/model

_MG_0557 11535.00 11535.00 11535.00     0.00     sensor saturated
_MG_0558 11536.00 11536.00 11536.00     0.00     sensor saturated
_MG_0559  9951.00 10993.00 10477.52    99.15      70.11    149.45    22334.6    100  1.000000    149.6     1.00
_MG_0560 10031.00 11139.00 10573.92    99.15      70.11    150.82    22747.5    100  1.000000    150.3     0.99
_MG_0561  6150.00  7018.00  6582.11    79.91      56.51    116.49    13569.3    100  0.645162    118.3     0.98
_MG_0562  6248.00  7102.00  6669.38    79.91      56.51    118.03    13931.4    100  0.645162    119.1     0.98
_MG_0563  3702.00  4415.00  4081.06    62.58      44.25     92.22     8504.7    100  0.384616     92.9     0.99
_MG_0564  3747.00  4377.00  4087.87    62.58      44.25     92.38     8533.2    100  0.384616     93.0     0.99
_MG_0565  2264.00  2781.00  2566.34    49.42      34.95     73.43     5392.7    100  0.250000     73.3     1.00
_MG_0566  2281.00  2830.00  2573.59    49.42      34.95     73.64     5423.2    100  0.250000     73.4     1.00
_MG_0567  1351.00  1752.00  1582.42    38.75      27.40     57.76     3336.0    100  0.162602     57.1     1.01
_MG_0568  1359.00  1743.00  1580.54    38.75      27.40     57.69     3328.1    100  0.162602     57.1     1.01
_MG_0569   852.00  1140.00   996.19    30.57      21.62     46.09     2123.9    100  0.096618     44.8     1.03
_MG_0570   849.00  1097.00   980.93    30.57      21.62     45.38     2059.3    100  0.096618     44.4     1.04
_MG_0571   512.00   710.00   620.47    24.43      17.27     35.92     1290.5    100  0.062500     34.6     1.04
_MG_0572   503.00   711.00   618.07    24.43      17.27     35.78     1280.5    100  0.062500     34.6     1.04
_MG_0573   320.00   457.00   390.52    19.96      14.12     27.66      765.3    100  0.040486     26.7     1.04
_MG_0574   312.00   461.00   394.69    19.96      14.12     27.96      781.8    100  0.040486     26.9     1.03
_MG_0575   188.00   301.00   243.33    16.56      11.71     20.78      431.8    100  0.024096     20.2     1.03
_MG_0576   189.00   316.00   254.92    16.56      11.71     21.77      474.0    100  0.024096     20.8     1.00
_MG_0577   112.00   198.00   156.03    13.92       9.84     15.86      251.4    100  0.015624     15.2     1.04
_MG_0578   114.00   210.00   156.43    13.92       9.84     15.90      252.7    100  0.015624     15.3     1.04
_MG_0579    66.00   142.00   101.54    12.53       8.86     11.46      131.3    100  0.010132     11.4     1.01
_MG_0580    61.00   136.00    98.79    12.53       8.86     11.15      124.3    100  0.010132     11.2     1.03
_MG_0581    30.00   105.00    64.58    10.84       7.67      8.42       70.9    100  0.006024      8.2     1.03
_MG_0582    31.00   101.00    64.56    10.84       7.67      8.42       70.9    100  0.006024      8.2     1.03
_MG_0583    13.00    75.00    41.63     9.91       7.01      5.94       35.3    100  0.003906      5.8     1.02
_MG_0584    11.00    77.00    41.87     9.91       7.01      5.98       35.7    100  0.003906      5.8     1.02
_MG_0585    -4.00    63.00    25.78     9.13       6.46      3.99       15.9    100  0.002532      3.9     1.03
_MG_0586    -8.00    56.00    23.48     9.13       6.46      3.64       13.2    100  0.002532      3.6     1.12
_MG_0587   -11.00    49.00    17.60     8.96       6.33      2.78        7.7    100  0.001506      2.8     1.00
_MG_0588   -15.00    55.00    17.53     8.96       6.33      2.77        7.7    100  0.001506      2.8     1.01
_MG_0589   -14.00    44.00    11.67     8.56       6.06      1.93        3.7    100  0.000976      1.9     1.01
_MG_0590   -17.00    41.00     9.91     8.56       6.06      1.64        2.7    100  0.000976      1.6     1.18
_MG_0591   -23.00    35.00     6.38     8.40       5.94      1.07        1.2    100  0.000634      1.1     1.00
_MG_0592   -27.00    35.00     6.62     8.40       5.94      1.11        1.2    100  0.000634      1.1     0.96
_MG_0593   -24.00    32.00     3.97     8.25       5.83      0.68        0.5    100  0.000376      0.7     1.00
_MG_0594   -25.00    39.00     4.17     8.25       5.83      0.71        0.5    100  0.000376      0.7     0.95
_MG_0595   -25.00    43.00     2.30     8.17       5.78      0.40        0.2    100  0.000244      0.4     1.00
_MG_0596   -25.00    30.00     2.72     8.17       5.78      0.47        0.2    100  0.000244      0.5     0.85


                      Table A2:  ISO 200 Sensor Data and Analysis

Offset= 2048
Model gain = 1.23 e/DN
Model read noise = 7.6 electrons

         Observed Observed Observed
            min     max     mean     2-img std    noise     S/N      signal     ISO  relative    S/N     S/N
    file    (DN)    (DN)    (DN)       (DN)       (DN)            (electrons)        exposure    model obs/model

_MG_0597 13255.00 13255.00 13255.00     0.00     sensor saturated
_MG_0598 13255.00 13255.00 13255.00     0.00     sensor saturated
_MG_0599 13255.00 13255.00 13255.00     0.00     sensor saturated
_MG_0600 13255.00 13255.00 13255.00     0.00     sensor saturated
_MG_0601 12278.00 13257.00 13088.49   146.62     103.67    126.25    15938.0    200  1.000001    126.7     1.00
_MG_0602 12607.00 13257.00 13241.76   146.62     103.67    127.72    16313.5    200  1.000001    127.4     0.99
_MG_0603  7480.00  8918.00  8235.19   125.57      88.79     92.75     8602.8    200  0.596155    100.4     0.92
_MG_0604  7434.00  8797.00  8195.07   125.57      88.79     92.30     8519.2    200  0.596155    100.1     0.93
_MG_0605  4505.00  5541.00  5030.62    97.71      69.09     72.81     5302.0    200  0.387500     78.3     0.93
_MG_0606  4569.00  5560.00  5111.64    97.71      69.09     73.99     5474.1    200  0.387500     78.9     0.92
_MG_0607  2752.00  3497.00  3164.79    76.26      53.93     58.69     3444.1    200  0.252033     61.9     0.95
_MG_0608  2775.00  3484.00  3178.18    76.26      53.93     58.93     3473.3    200  0.252033     62.1     0.95
_MG_0609  1682.00  2203.00  1949.83    59.27      41.91     46.52     2164.4    200  0.149758     48.4     0.96
_MG_0610  1677.00  2240.00  1975.01    59.27      41.91     47.12     2220.7    200  0.149758     48.7     0.96
_MG_0611  1023.00  1414.00  1232.22    46.87      33.14     37.18     1382.4    200  0.096875     38.2     0.97
_MG_0612  1022.00  1425.00  1239.68    46.87      33.14     37.41     1399.2    200  0.096875     38.3     0.97
_MG_0613   634.00   919.00   786.45    38.00      26.87     29.27      856.4    200  0.062753     30.2     0.97
_MG_0614   636.00   907.00   785.94    38.00      26.87     29.25      855.3    200  0.062753     30.2     0.97
_MG_0615   379.00   602.00   481.95    30.15      21.32     22.60      511.0    200  0.037349     23.2     0.97
_MG_0616   390.00   620.00   502.41    30.15      21.32     23.56      555.3    200  0.037349     23.8     0.95
_MG_0617   228.00   390.00   308.63    24.25      17.15     18.00      324.0    200  0.024217     18.2     0.99
_MG_0618   236.00   386.00   309.91    24.25      17.15     18.08      326.7    200  0.024217     18.2     0.99
_MG_0619   130.00   262.00   189.72    19.88      14.06     13.49      182.1    200  0.015705     13.7     0.99
_MG_0620   134.00   268.00   202.95    19.88      14.06     14.44      208.4    200  0.015705     14.2     0.95
_MG_0621    63.00   186.00   125.11    17.05      12.06     10.38      107.7    200  0.009337     10.6     0.98
_MG_0622    75.00   187.00   125.21    17.05      12.06     10.39      107.9    200  0.009337     10.6     0.98
_MG_0623    23.00   141.00    82.84    14.56      10.30      8.05       64.7    200  0.006054      8.1     1.00
_MG_0624    23.00   150.00    76.85    14.56      10.30      7.46       55.7    200  0.006054      7.7     1.05
_MG_0625   -12.00   122.00    50.34    12.47       8.82      5.71       32.6    200  0.003925      5.7     1.01
_MG_0626    -6.00   113.00    45.77    12.47       8.82      5.19       27.0    200  0.003925      5.3     1.08
_MG_0627   -22.00    81.00    30.17    10.92       7.72      3.91       15.3    200  0.002334      3.8     1.03
_MG_0628   -22.00    80.00    28.61    10.92       7.72      3.70       13.7    200  0.002334      3.6     1.07
_MG_0629   -36.00    71.00    19.05    10.36       7.33      2.60        6.8    200  0.001513      2.6     1.00
_MG_0630   -39.00    85.00    20.79    10.36       7.33      2.84        8.1    200  0.001513      2.8     0.93
_MG_0631   -34.00    63.00    14.53    10.01       7.08      2.05        4.2    200  0.000983      2.1     1.00
_MG_0632   -33.00    63.00    14.56    10.01       7.08      2.06        4.2    200  0.000983      2.1     1.00
_MG_0633   -45.00    67.00     9.85     9.55       6.75      1.46        2.1    200  0.000583      1.4     1.01
_MG_0634   -44.00    57.00     8.66     9.55       6.75      1.28        1.6    200  0.000583      1.3     1.13
_MG_0635   -39.00    62.00     5.87     9.29       6.57      0.89        0.8    200  0.000378      0.9     1.00
_MG_0636   -41.00    52.00     6.28     9.29       6.57      0.96        0.9    200  0.000378      1.0     0.94


                    Table A3: Read Noise Data and Analysis

  file      min     max     mean     2-img std    noise            electrons  gain(e/DN) ISO
_MG_0427  2022.00  2088.00  2047.13     7.96       5.63               12.102    2.150    100
_MG_0428  2021.00  2078.00  2047.82     7.96       5.63               12.102    2.150    100
_MG_0429  2004.00  2110.00  2048.31     8.74       6.18                7.598    1.230    200
_MG_0430  2001.00  2100.00  2047.84     8.74       6.18                7.598    1.230    200
_MG_0431  1954.00  2147.00  2047.19    11.25       7.95                4.852    0.610    400
_MG_0432  1957.00  2157.00  2047.57    11.25       7.95                4.852    0.610    400
_MG_0433  1879.00  2298.00  2047.00    17.16      12.13                3.762    0.310    800
_MG_0434  1864.00  2253.00  2046.92    17.16      12.13                3.762    0.310    800
_MG_0435  1736.00  2477.00  2046.68    28.68      20.28                3.042    0.150    1600
_MG_0436  1744.00  2451.00  2047.99    28.68      20.28                3.042    0.150    1600
_MG_0437  1531.00  2637.00  2047.52    49.94      35.31                2.719    0.077    3200
_MG_0438  1379.00  2611.00  2046.91    49.94      35.31                2.719    0.077    3200

Data acquired by Peter A. Hawrylyshyn, M.D.  November, 2009
Thermal data acquired by R. Clark, Dec 2013 to Jan 2014.
Analysis by R. N. Clark December 31. 2009
References
1)
CCD Gain. http://spiff.rit.edu/classes/phys559/lectures/gain/gain.html
2)
Charge coupled CMOS and hybrid detector arrays
http://huhepl.harvard.edu/~LSST/general/Janesick_paper_2003.pdf
3)
Canon EOS 20D vs Canon EOS 10D and
Canon 10D / Canon 20D / Nikon D70 / Audine comparison
http://www.astrosurf.org/buil/20d/20dvs10d.htm
4)
http://www.photomet.com/library_enc_fwcapacity.shtml
5)
Astrophotography Signal-to-Noise with a Canon 10D Camera
http://clarkvision.com/astro/canon-10d-signal-to-noise
Notes:
DN is "Data Number." That is the number in the file for each
pixel. I'm quoting the luminance level (although red, green
and blue are almost the same in the cases I cited).
16-bit signed integer: -32768 to +32767
16-bit unsigned integer: 0 to 65535
Photoshop uses signed integers, but the 16-bit tiff is
unsigned integer (correctly read by ImagesPlus).
Back to:
Digital Camera Sensor Analysis pages on this site:
http://clarkvision.com/articles/index.html#sensor_analysis
http://clarkvision.com/reviews/evaluation-canon-7d
First published December 31, 2009.
Last updated November 5, 2014.