
Digital Cameras: Does Pixel Size Matter?
Factors in Choosing a Digital Camera
(Does Sensor Size Matter?)
by Roger N. Clark
Contents
All images, text and data on this site are copyrighted.
They may not be used except by written permission from Roger N. Clark.
All rights reserved.
If you find the information on this site useful,
please support Clarkvision and make a donation (link below).
Introduction
In today's Digital Camera market there is a bewildering array of models
to choose from. I recently faced such a decision when I wanted to buy
a small point and shoot digital camera. I wanted a small size, high megapixel
count, fast response time (low shutter lag), and low noise camera.
I did not get what I wanted because it did not exist at the time of my
purchase. After a little research, I find I never will get what I
wanted, unless someone comes up with a way to break the laws of physics.
I hope to show you what I mean in this article.
Counting Photons
The sensor in today's digital cameras uses a charge-coupled device, CMOS
sensor or other similar device that is an array of pixels. Each pixel,
is a semiconductor material that absorbs photons and liberates electrons.
The electrons are gathered and held in what is called a potential well, or
voltage well that prevents the electron from drifting away. The analogy
is a bucket of water holding rain drops, and the photons are the rain
drops falling on the buckets. This analogy is shown in Figure 1a.
But the Figure 1a analogy is incomplete: we need a lens. Figure 1b shows
a more complete analogy: funnels collect rain drops and deliver the water
to buckets.
Figure 1. Photon rain: the analogy of photons falling into
buckets which collect the rain drops. A larger bucket collects more
drops. Given two sensors with equal numbers of pixels, and each
with lenses of the same f/ratio, the larger sensor collects more
photons yet has the same spatial resolution. The lens for the
larger sensor would have a longer focal length in order to cover the
same field of view is the system with the smaller sensor and the lens
will also have a larger aperture diameter, thus collecting more light.
It is the larger aperture that delivers the light to the pixel and the
larger pixel simply enable collection of the increased light delivered
by the lens. This is shown in Figure 1b.
It is generally assumed on the internet that larger pixels collect
more light and that cameras with larger pixels have greater low light
sensitivity. Larger pixels do have higher maximum signal capacity per pixel
(called full well capacity).
But that
is like saying my bucket has more water in it just because it is a 5-gallon
bucket and you only have a one gallon bucket. But did I actually put any
water in the bucket? In one recent argument, an internet poster said put
out a thimble next to a swimming pool and see which one collects more
rain drops. Well, that is obvious but the analogy to light and cameras is
lacking one thing: a lens, or in the case of rain drops, a funnel. The
rain drop analogy is good because like raindrops, light is composed of
photons (particles of light) that randomly arrive at our eyes and camera
lens. To illustrate this concept, consider the graphic in Figure 1b. The
photon rain analogy can be considered raindrops on a rainy day, or photons
coming to our camera. The orange lines represent funnels in the rain,
or a lens focusing light onto a pixel in a camera. Two different cameras
are illustrated, one having large pixels and one having pixels half the
size. The lens collects the light and as long as the lens diameters
are the same. This results in equal performance as long as the pixel
does not overflow (see Figure 9 caption). The amount of rain (photons)
in each bucket (pixel) is the same. In practice, depending on the camera
technology, sensor and camera electronics noise can make one camera versus
another better or worse performer, in one case making the large pixel camera
the better low light performer, and in another the camera with small pixels
the better performer. Either way, the key to low light performance is
collecting as much light as possible.
Figure 1b. Raindrops (blue) as an analogy to photons entering a
camera. The buckets ("pixels") fill with water (blue), but the orange
funnels collect the rain and focus it onto the buckets (pixels). In this
case the large end of the funnels have the same diameter so collect the
same amount of rain per unit time (the exposure). The ONLY difference
is the small bucket will fill up faster, but that is not a problem in
low light situations. Small buckets are NOT a disadvantage. The funnel
diameter controls how much rain goes into the bucket, not the size of
the bucket. It is the same with cameras, lenses, and pixels. The angle
"a" is the is the angular size of a pixel and is the same for both the
large and small pixel in this example. In a camera, both cameras would
get the same amount of light per pixel, show the same noise, have the
same pixels on the subject, and have the same depth of field.
When the image is ready to be read out, the signal from the pixel
is sent to an amplifier and then an analog-to-digital (A to D) converter.
In the water bucket analogy, the walls of the bucket must be thick enough so
the water does not leak out and get into the adjacent bucket. This sets
minimum sizes for the walls and sizes of the hole the water can fall into,
and in the electronic world, how big the electron well walls must be, how
far apart they must be, and restricts the size of the active area where
photons are absorbed to generate electrons. Even if some advances are made in
these areas, there is one fundamental limit: photon counting statistics.
In the analogy of the photon rain filling buckets, as shown in Figure 1,
the, larger the bucket, the more drops that can be collected in a given
amount of time. This is important for a very fundamental reason: the
accuracy of the signal measured is directly proportional to the size of
the signal. In the physics of photon counting, the noise in the signal
is equal to the square root of the number of photons.
What we perceive as noise in our digital camera images is the signal-to-noise ratio,
S/N. Only at the very lowest signal levels does camera electronics noise
become a factor (e.g. low level banding).
Example photon noise and S/N:
Table 1

Photons  Noise   signal-to-noise
    9      3           3
  100     10          10
  900     30          30
10000    100         100
40000    200         200
The Light that is absorbed in the silicon sensor does so over a very limited
range. Back to the bucket in the rain analogy. Making a deeper bucket does not
help with electronic sensors because the light will not penetrate any deeper.
So to collect more light, only area matters, and this is why in Figure 1a, and 1b
the bucket depth is the same for small and large pixels.
Why is this important? It turns out that the noise in good modern digital
cameras is dominated by photon counting statistics, not other sources.
This is explained in detail at:
The Signal-to-Noise of Digital Camera images and Comparison to Film,
and
How to Interpret Digital Camera Sensor Reviews.
Some of the data from articles on the clarkvision.com site are shown here
for several cameras from top end professional DSLRs to
prosumer DSLRs, and Point and Shoot cameras, "P&S."
Figure 2 and 3 show that the the top
pro model as well as the consumer point and shoot camera discussed here
are photon noise limited. In fact, all modern digital cameras tested in
the last few years have been shown to be photon noise limited at signal
levels above a few tens of photons. For example, see sensor analyses
and further references at:
http://clarkvision.com/reviews/.
Figure 2. The Canon 1D Mark II is photon noise limited at all ISO settings.
Only photon noise shows the square-root dependence on signal seen here.
Figure 3a. The noise from the Canon S70 point and shoot consumer camera is photon noise limited
for all levels above about 10 photons. Blue points are measured values, and the red
line is a model with: maximum signal = 8,200 photons (electrons), read noise = 4.1 electrons.
Only photon noise shows the square-root dependence on signal seen here.
Figure 3b. The signal-to-noise from the small sensor, 2.3 micron pixel
pitch, Canon S70 point and shoot consumer camera is compared to that from
a large sensor, 8.2 micron pixel pitch, Canon 1D Mark II DSLR camera.
The signal-to-noise ratio of an 18% gray card is at 0-stops, with
brighter parts of the image are to the right, and darker parts to the
left, following each curve. For example, the Canon 1D mark II at
ISO 100 would record a signal-to-noise ratio of about 100 on the
18% gray card but only about 10 in shadows at -5.5 stops (follow
the magenta line).
The 1D Mark II has about 13 times the light collection ability of the small S70 camera.
The lower slopes of the lines above a signal-to-noise ratio of about 8
indicates the noise in the images are photon noise dominated, while at
lower ratios, the signal becomes increasingly read noise dominated.
An example of large versus small pixels and the effects on image quality
is illustrated in Figures 4 and 5.
BUT DO NOT BE FOOLED--READ THIS ENTIRE PARAGRAPH!
The common idea on the internet is that the sensor is responsible for
the increased light and noise performance. The idea is that the smaller pixels in the smaller
sensor of the S70 camera collect less light. Here is the typical photographer
setup equalizing exposure time, ISO and f-ratio between two cameras.
Figure 4a and 4b shows the full
scene recorded by two cameras set at the same ISO (ISO 400), same f/stop
(f/4.5), and same exposure time (1 second). The pixel pitch (the distance
from one pixel to the next; the actual pixel area sensitive to light is
slightly smaller) is 8.2 microns for the large sensor, large pixel camera (Canon 1D
mark II) versus the small sensor, small pixel camera (Canon S70). Both cameras have
almost identical read noise at ISO 400: 5.6 electrons for the 1D Mark
II and 4.3 electrons for the S70, thus the S70 has a slight advantage!
But despite the read noise advantage, the larger pixels of the big
camera collects so much more light per pixel that the image quality is
much better than the small pixel camera (Figure 5). WHY?
The lens apertures are different!
The light is delivered by the lens, and the lens is the real
reason the large pixels are able to collect more light.
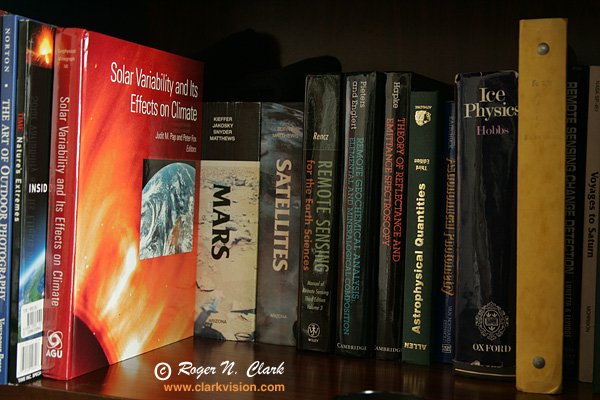
Figure 4a. The Canon 1D Mark II DSLR full test scene: books in a bookshelf.
ISO 400, f/4.5 1, second exposure. The lens is 44 mm focal length, f/4.5 so the lens
aperture diameter = 9.8 mm.

Figure 4b. The Canon S70 Point and Shoot camera full test scene: books
in a bookshelf. ISO 400, f/4.5, 1 second exposure.
The lens is 13.2 mm focal length, f/4.5 so the lens
aperture diameter = 2.9 mm.
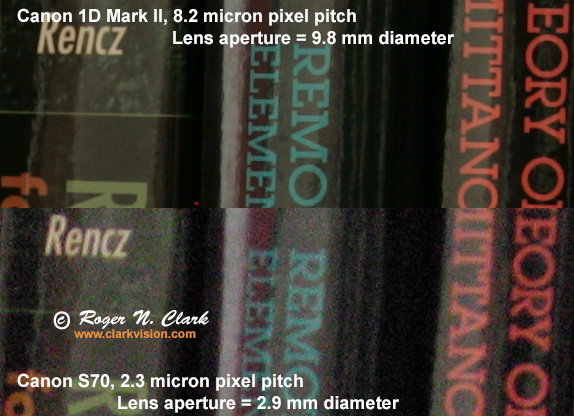
Figure 5. Full image crops from Figures 4a and 4b. The crops are from
raw converted 16-bit TIF images converted by Canon Zoombrowser software
with the same (default) settings for both cameras. Both cameras recorded
the same exposure at the same ISO, and same f/ratio: ISO 400, f/4.5, 1
second exposure. The larger lens diameter collected more light and fed that light
to the pixels of the 1D Mark II to produce higher
signal-to-noise images than the small lens diameter feeding
the small sensor, small pixels of the S70. Both cameras
are photon noise limited, as are these images. The signal-to-noise
ratio is abut 3.5 times higher for the 1D Mark II image, close to the
ratio of the lens aperture diameter, the pixel pitch, and the sensor sizes from each camera.
The CAUSE is the lens which delivered more light to the 1D Mark II image,
making the better image. The sensor and pixels are
just buckets to collect the light delivered by the lens.
True Equalization of Light Between Cameras
At this point, you may be quite confused. The internet is full of people
saying larger format cameras with larger pixels are more sensitive,
and the show images to prove it. But what is the real cause?
In such cases, photographers try and equalize the parameters they are familiar
with: exposure time, f-ratio, and ISO, the so-called exposure triangle.
But equalizing these three things does not necessarily mean
the the actual light delivered to the sensor is equalized. If the light
is not equalized, the actual sensor performance can not be
accurately assessed.
Of the three parameters, exposure time, f-ratio, and ISO, only exposure
time is the true parameter that is actually equalized in terms of total
amount of light when set to a constant value between cameras.
ISO is not constant between cameras. For example, ISO 100 on the Canon
1D Mark II shown here has a range of 0 to 79,900 photons (photoelectrons),
while the S70 has a range of only 0 to 4100 photons.
Constant f-ratio delivers constant light density to the focal plane, but NOT
the same total light from the subject! Lens aperture area determines
the total light collected from the subject.
To equalize the light delivered to the sensor and have it digitized
equally, one needs to make 4 parameters equal: 1) exposure time,
2) Photoelectron digitization range, 3) lens aperture area (lens
aperture diameter, technically called the entrance pupil), and the
number of pixels on the subject equal. For the Cameras used above,
I equalized these three parameters and show the results in Figure 6.
When the pixels on the subject and lens aperture area are equalized,
this is called equalizing the Etendue. Then for the same exposure
time one delivers the same amount of light to the sensor. Then sensor
characteristics can be fairly compared (Figure 6). When that is done,
the images are virtually indistinguishable, including apparent noise
and depth of field.
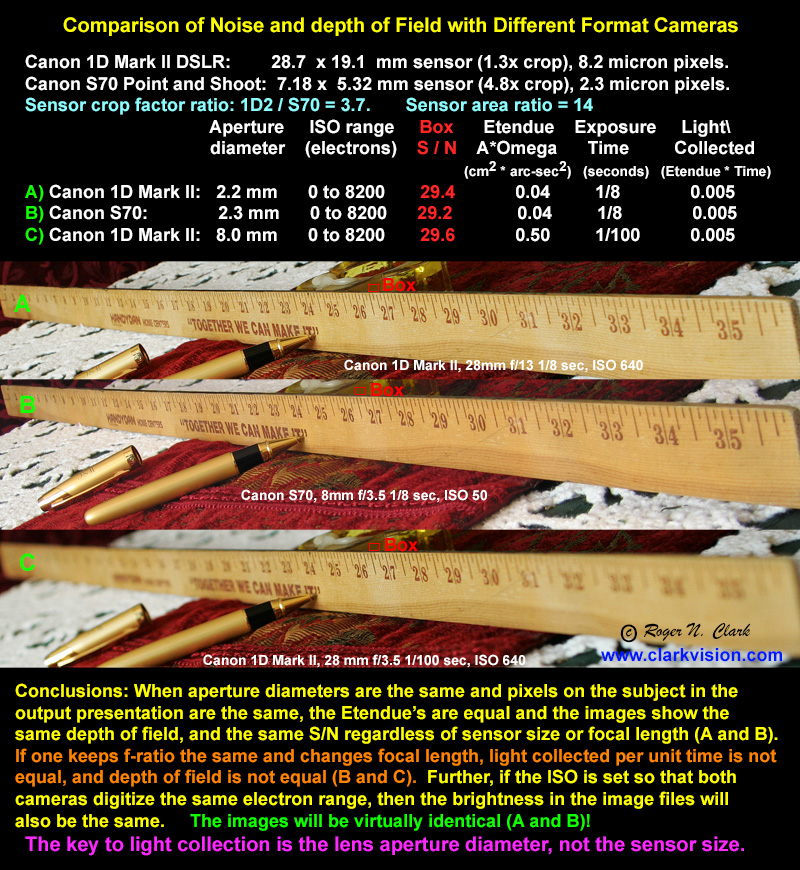
Figure 6. Illustration of equal Etendue results in the same image
quality independent of sensor size, pixel size, and focal length or f/ratio!
Dynamic Range
A large dynamic range is important in photography for many situations.
The pixel size in digital cameras also affects dynamic range. Dynamic range
is defined here to be the maximum signal divided by the noise floor at each ISO.
The noise floor is a combination of the sensor read noise, analog-to-digital
conversion limitations, and amplifier noise. These three parameters
can not be easily separated when evaluating digital cameras, and the combinations is generally
called the read noise (or apparent read noise).
As you might have surmised by now,
with the larger pixels collecting more photons, those larger pixels also
have a a potential for higher dynamic range if the camera's electronics have the
specifications to handle the range. Figure 7 shows the measured dynamic range
from 3 cameras with significantly different pixel sizes as a function of ISO.
The full sensor analyses for these 3 cameras (as well as other cameras) can be found at:
http://clarkvision.com/articles/reviews/.
Large pixel cameras are often limited by noise in downstream
electronics, such as from the analog-to-digital converters. If such noise
could be eliminated, the dynamic range could increase in cameras with large pixels
by about 2 or more stops when operating at low ISOs.
Indeed, some cameras from Nikon and Sony do show dynamic ranges a little
larger than that shown in Figure 7.
The current smallest pixel cameras do not collect enough
photons to benefit from higher bit converters.
Figure 7. The dynamic range for 3 different cameras is shown, along
with models that show what performance would be if electronics noise
after the sensor was zero.
Large pixel cameras can have a larger dynamic range. The small pixel camera
has a very good dynamic range at low ISO, but that range rapidly deteriorates with
increasing ISO. The larger pixels have greater dynamic range at all ISOs,
beating smaller pixel cameras. Further, the large pixel cameras have high dynamic
range over a larger range of ISO.
The measured dynamic range (symbols) is shown with models of
the expected dynamic range (dashed lines). The dynamic range is often limited
by the A/D converter and other electronics in the system,
illustrated by the measured data falling below the model at lower ISOs.
The dynamic range for more cameras can be found at
Digital Camera Sensor Performance Summary
http://clarkvision.com/articles/digital.sensor.performance.summary
and
http://clarkvision.com/articles/reviews/.
Sensor Sizes
Sensor sizes in smaller cameras are specified by a strange parameter,
like 1/1.8" which dates from TV camera tubes from the 1950s. In my opinion,
this is simply to confuse consumers as to the true nature of the small
sensors. See
Sensor Sizes http://www.dpreview.com/learn/?/Glossary/Camera_System/Sensor_Sizes_01.htm
for more details. Here are some simple translation numbers
         Table 5
               Sensor Size (mm)
Type            Width   Height
1/6             2.40    1.80
1/4             3.60    2.70
1/3.6"          4.00    3.00
1/3.2"          4.54    3.42
1/3"            4.80    3.60
1/2.7"          5.37    4.03
1/2.5"          5.76    4.29
1/2.3"          6.16    4.62
1/2"            6.40    4.80
1/1.8"          7.18    5.32
1/1.7"          7.60    5.70
1/1.6"          8.08    6.01
2/3"            8.80    6.60
1"             12.80    9.60
4/3"           18.00   13.50
APS C          23.70   15.70 (1.6x crop; also called 1.8")
APS-H          28.7    19.1  (1.3x crop)
35 mm film     36.00   24.00
Diffraction
Diffraction also limits the detail and contrast in an image. The diffraction spot
diameter in the focal plane of an optical system is proportional to the f/ratio
according to the formula:
Diffraction spot diameter = 2 * 1.22 w * f / D = 2.44 * w * f_ratio,
where w = wavelength, f = focal length, D = aperture diameter, and
f_ratio is the f/ratio of the optical system.
The diffraction spot size is given in the table below:
                          Table 6
        ================================================
                     red=     Green=    Blue=
                      0.6      0.53      0.47
                    micron   micron    micron
        ================================================
        f/ratio     diffraction spot diameter in microns
        ================================================
               2      2.9       2.6       2.3
             2.8      4.1       3.6       3.2
               4      5.9       5.2       4.6
             5.6      8.2       7.2       6.4
               8     11.7      10.3       9.2
              11     16.1      14.2      12.6
              16     23.4      20.7      18.3
              19     27.8      24.6      21.8
              22     32.2      28.5      25.2
              32     46.8      41.4      36.7
              45     65.9      58.2      51.6
              64     93.7      82.8      73.4
        ================================================
The wavelengths are the approximate centers of the red, green and blue
filters in digital cameras. Note the diffraction size is larger for
redder colors.
Compare the diffraction diameters with pixel sizes in digital cameras.
The Canon 1D Mark II discussed above has 8.2 micron pixel spacing, and
with the blur filter which is used on most Bayer-sensor cameras, the
resolution is perhaps 30% worse, so about 11 microns. At about f/8 the
camera pixels + blur filter matches the blur due to diffraction. But the
same trade point in the small sensors in the Canon S60, with 2.7 micron
pixel spacing, occurs at f/2.8. This diffraction spot size versus pixel
size trade point occurs at a 20% degradation in high frequency contrast
(80% MTF, the Modulation Transfer Function). The contrast reduction is
shown in more detail in Figure 8. Diffraction at this point is beginning
to limit resolution but not seriously so. But using apertures smaller
than this trade point means the image resolution is becoming more limited
by diffraction, not the sensor. Unless you work with very fast, sharp,
lenses all the time, you need larger pixels in order to maintain high
contrast in the pixel-to-pixel image detail. Thus, cameras with a larger
sensor containing more pixels have the advantage against being limited
by diffraction. If you decrease pixel size, of course you don't lose
resolution in the image, just the pixel-to-pixel contrast in fine
details will be less.
Figure 8. Diffraction affects image detail by reducing contrast.
The technical term for the contrast reduction is called the
Modulation Transfer Function (MTF) and describes the contrast
the camera delivers as a function of the spacing of lines (called the
spatial frequency).
Here the spatial frequency is expressed in terms of pixel spacing.
As the f/stop number increases (e.g. f./4 to f/8), the diffraction spot becomes larger, and
fine detail in the image becomes reduced in contrast.
The red, green and blue lines show the diffraction effects for red,
green and blue wavelengths of light for f/ratios 1, 2, 4, and 8.
Enlargement
In order to make a given print size, the image must be enlarged from the
small image in the focal plane of the camera. For example, say you want
to make 8 x 10 inch (203 x 254 mm) prints. If your sensor is like the
Canon S60 at 7.18 x 5.32 mm, one would need about a 36 times enlargement.
Such extreme enlargement would magnify any lens imperfections, and
vibration during the exposure. The larger sensor of the 1D Mark II, with
its 28.7 x 19.1 mm sensor, needs only a 10.6 times enlargement (making an
8 x 12 inch print), or 3 times less enlargement of lens imperfections and
vibration than the S60.
Traditionally in photography, larger formats
have produced better images on the final print. A major factor in image
quality is the enlargement factor. Large formats (like 8x10 or 4x5 film
and now large format digital scanning backs) produce spectacular large
prints that can't be matched by smaller (e.g. 35mm and smaller) formats.
Those factors scale to even smaller formats of present point and shoot
small sensor digital cameras.
The f/ratio Myth
There is a common idea in photography that exposure doesn't change between
different size cameras when working at the same f/ratio. For example,
the sunny f/16 rule says a good exposure for a daylight scene is 1/ISO
at f/16. Thus for ISO 100 film, you use a 1/100 second exposure on
an 8x10 camera at f/16, a 4x5 camera at f/16, a 35mm camera at f/16,
an APS-C digital camera at f/16, down to the smallest point and shoot
camera at f/16 (assuming the small camera goes to f/16). The myth is
that every camera will provide the same signal-to-noise images as long
as the same exposure time and f/ratio lens is used, from the camera with
the smallest sensor, to the camera with a large sensor.
The concept of constant exposure for a given f/ratio leads people to
think cameras scale easily and still give the same image. But there is a
fallacy in this idea, and that is the spatial resolution on the subject.
The smaller camera, even at the same f/ratio, has a smaller lens which
collects a smaller number of photons per unit time. The smaller camera
gets the same exposure time because the UNIT AREA in the focal plane
represents a larger angular size on the subject. Exposure is not the
same as light gathered. Exposure is a relative measure of how much
a pixel might be filled. The larger pixel can collect more light before
it is called half full (think of large and small buckets of water: the
small bucket at half full holds less water than the larger bucket
at half full).
The rate of arrival of photons in the focal plane of a lens
per unit area per unit time is proportional to the square of
the f-ratio. Corollary: if you keep f/ratio constant, and change
focal length then the photons per unit area in the focal plane is
constant but spatial resolution changes.
So how does this apply to making smaller cameras?
The problem is that if you scale a camera down, say 2x in linear size,
the aperture drops by 2x in diameter, the focal length drops by 2x (to
give the same field of view), the sensor size drops by 2x (linearly or
4x the area), and the pixel size drops by 2x (linearly or 4x the area,
to give the same spatial resolution on the subject). The aperture has
collected only 1/4 the number of photons. If we kept the same sensor,
then each pixel would collect the same number of photons because each
pixel now sees a larger angular area (4x larger). But we want the
same resolution, so the pixels are 2 times smaller (4x smaller area).
The smaller pixels each collect 1/4 less photons since their area is
divided by 4 to keep spatial resolution constant and the fundamental
cause of the lower light collected is due to the smaller lens because
it collects and delivers a smaller number of photons to the pixels.
The cause is NOT due to the smaller pixels.
Another way to look at the problem is aperture collects light, the
focal length spreads out the light, and the pixels are buckets that
collect the light in the focal plane. BUT THE TOTAL NUMBER OF
PHOTONS
DELIVERED TO THE FOCAL PLANE IS ONLY DEPENDENT ON APERTURE
(ignoring transmission losses of the optics). Thus, photons
delivered to a pixel for a given resolution on the subject goes as the
square of the aperture (and camera size when the lens is scales with the
camera format size and f-ratio is maintained)! Decreasing your camera
by 2x means 4x less photons per pixel if you want to maintain field of
view, f-ratio and megapixel count!
This is just what we observe with small cameras: their
smaller sensors have smaller full well capacities, that get filled
for a given exposure time with a smaller number of photons
that is delivered by the smaller lens.
That in turn means higher noise because there are fewer
photons. But this scaling is ONLY TRUE if we scale the lens down
with the smaller sensor. But IF we keep the lens aperture area
the same, then we deliver the same amount of light in the same exposure
time.
Example: a full frame 20 megapixel camera and 2x crop sensor 20 megapixel
camera. If you use a 50 mm f/4 lens on the full frame (FF) camera then to
get the same light, same apparent noise, same pixels on subject and
same depth of field, we would use a 25 mm focal length f/2 lens on the
crop camera. In both cases, the lens aperture diameters are 12.5 mm.o
Let's extend that to lower light faster lenses. Put a 50 mm f/1.4 lens
on the full frame camera. To have equal light with the crop camera,
one would need a 25 mm f/0.7 lens. But such a lens does not exist!
So the larger format camera enables one to use larger aperture
lenses that do not exist for smaller format cameras.
That also means the smaller camera would not be much smaller,
due to the lens, and might be more expensive due to the lens specifications.
For photon noise limited cameras with constant f-ratio lens,
signal-to-noise ratio achievable in an image for constant exposure time
is the square root of the number of photons collected, so signal-to-noise
ratio scales linearly with the camera pixel size (again for constant
f-ratio lenses). That concept is illustrated in Figure 5, above: the
small sensor camera with its smaller lens produced a noisier image than
the larger sensor camera with its larger lens even though the f/ratio,
exposure and ISO are the same for the two cameras (which as we have seen
does not mean equal light).
See also: The f/ratio Myth and Digital Cameras
http://clarkvision.com/articles/f-ratio_myth
Check out this web page for more info on this subject:
http://www.stanmooreastro.com/f_ratio_myth.htm
, and
Characteristics of Best Digital Cameras and Lenses
for Nightscape and Astro Photography.
The Depth of Field Myth
After understanding the concepts in the f/ratio myth, there
is another major implication of scaling sensors.
Given the identical photon noise, exposure time, enlargement size,
and number of pixels giving the same spatial resolution (i.e. the
same total image quality), digital cameras with different sized
sensors will produce images with identical depths-of-field. (This
assumes similar relative performance in the camera's electronics,
blur filters, and lenses.) The larger format camera will use a
higher f/ratio and an ISO equal to the ratio of the sensor sizes to
achieve that equality. If the scene is static enough that a longer
exposure time can be used, then the larger format camera will
produce the same depth-of-field images as the smaller format camera,
but will collect more photons and produce higher signal-to-noise
images. Another way to look at the problem, is the larger format
camera could use an even smaller aperture and a longer exposure to
achieve a similar signal-to-noise ratio image with greater depth of
field than a smaller format camera. Thus, the larger format camera
has the advantage for producing equal or better images with equal or
better depth-of-field as smaller format cameras.
The details of these concepts are discussed here:
The Depth-of-Field Myth and Digital Cameras
http://clarkvision.com/articles/dof_myth
Different Sized Pixels in the Same Sized Sensor
We have considered cameras with the same number of pixels and different
sized sensors and shown that cameras with larger sensors and larger pixels
collect more light given the same f/ratio lens and field of
view, thus have better low light and high ISO performance.
But now we also have choices of different cameras having the same sized
sensors but with pixels varying in size and number.
What are the implications of this situation?
There are apparently heated debates on the net regarding this issue with
passionate arguments for smaller and for larger pixels in the same sized sensor.
Many have used data in this article and my
Digital Camera Sensor Performance Summary
article to argue both sides. Like many positions on extremes, some of these arguments
ignore key factors.
The argument for smaller pixels goes like this. Smaller pixels in the same
sized sensor record finer details. You can always average pixels to get back
to effectively larger pixels. In high signal parts of an image this argument
is correct except for one factor: smaller pixels have lower dynamic range
(see Figure 7, above). If your smaller pixel blow the highlights, you have
lost all the image detail. But if you don't blow the highlights, smaller
pixels are better when you have plenty of light. The noise in the image
will be dominated by photon noise (the best one can do) and you can in
software trade noise for resolution. And by averaging pixels, one can
improve the dynamic range. So higher megapixel cameras have merit.
In a perfect camera, the only noise you would record would be that from
photons (the ultimate physical limit). But cameras have other sources
of noise
(see
Digital Camera Sensor Performance Summary),
including read noise, electronics noise, noise from dark current (thermal noise),
and fixed pattern or banding noise.
This changes the equation on pixels, low light performance,
and high ISO photography.
As light levels fall, whether in the shadows of a daytime scene, indoor
photography with low light, to night photography, cameras must
make do with less light for the image. This means that the electronics
noise in the camera becomes a greater portion of the total noise
we perceive in images. And it is this fact that can limit the idea
of making smaller and smaller pixels. This electronics noise is also
a factor in the reduced dynamic range of smaller pixels.
So with the increased apparent noise, lower dynamic range, and the fact that
lenses can not deliver finer and finer detail because they
become diffraction limited,
the image quality can't increase forever as pixel size
decreases. Another factor in small pixels is the absorption length
of photons
in the silicon sensor: it ranges from about 1 micron for blue light
to over 7 microns for red light (see Table 1B at
Digital Camera Sensor Performance Summary).
The absorption length will also limit the image detail, especially
toward red colors. So there are detrimental effects of pixels that
are too small.
Now lets consider large pixels. The ultimate in high signal-to-noise
ratio, high dynamic range, and high ISO performance would be one large
pixel. Obviously a camera with one large pixel does not form a very
good image. Clearly some pixels are necessary to provide an image, and
recent full frame cameras with 20+ megapixels deliver outstanding image
detail. Too few pixels are bad for image quality and too many
pixels are bad for image quality. So there must be an optimum.
My Apparent Image Quality (AIQ) model, discussed in more detail in
Digital Camera Sensor Performance Summary
shows an optimum pixel size (Figure 9). For cameras with diffraction
limited lenses operating at f/8, the model predicts a
maximum AIQ around pixels of 5 microns. Many APS-C cameras
are operating near that level. As of this writing, full frame
35 mm digital cameras exit with 36 to 50 megapixels with between 4 and 5 micron
pixels with impressive image quality, but only if used with
excellent lenses.
Figure 9. Apparent Image Quality, from
Digital Camera Sensor Performance Summary.
The models closely predict
performance for modern cameras (within about 10% for
large pixels, and 20% for small pixels). Older cameras and sensors fall below the
model, e.g. typically due to low fill factors. Higher quantum
efficiency (QE) sensors than the model (45%) would plot above the model (by a
factor of square root 2, 1.41x higher AIQ for a ~100% QE sensor).
Solid colored lines indicate constant sensor size in megapixels. Dashed
colored lines indicate constant format sized sensors. The "Full-Frame"
sensor is the same size as 35-mm film. As one moves to the left along a
constant format line, AIQ first increases until diffraction begins to
take effect, then AIQ decreases. Diffraction at f/8 is used for the Full
Frame, 1.3x-crop, and 1.6x-crop sensors, and f/7 for the 4/3 sensor
(long dashed lines), f/4 for the Full Frame and 2/3" small-format sensors,
and f/2.8 for the smallest sensor shown, 1/1.8" (short dashed lines). The
smaller f/ratios are needed as sensor size decreases in order to
make the model fit observed data. This indicates smaller format cameras
must have very high quality lenses in order to deliver performance at
high megapixels. Diffraction limits the effective megapixels. When pixels
become very small, they hold so few electrons that dynamic range
suffers, and this causes the turn down in AIQ at pixel sizes below 2 microns
pixel pitch. See the discussion of diffraction, above, which will
further limit AIQ. For example, the AIQ for the Canon 7D plots above
the model line for its 1.6x crop sensor. But that AIQ will only be
realized of the lens used with the camera is diffraction limited below f/8.
Same Lens, Different sensor and Pixel Size
Now let's examine a common example of using the same lens on different cameras,
so that sensor size and pixel sizes are different. The amount of
light captured in a pixel is dependent on the lens delivering the
light. There is an additional factor in cameras and lenses: the area
the pixel covers. If we equalize the area, and thus pixels on subject,
then using the same lens, same f/ratio, same exposure time, the light
per pixel is the same. We can equalize the pixel area between a camera
with large pixels and one with small pixels by simply adding pixels,
or fractions of pixels together. Figure 10 shows such an example.
The lens delivers the light. The pixel is just a bucket. Below in
Figure 10 is a comparison of images made with a full frame and 1.6x crop
cameras. If we believed the internet myth that larger sensors are more
sensitive, one would expect a noise difference between full frame and
crop cameras to be the square root of the pixel areas, or sqrt(2.59) =
1.6, which would make the crop camera image noticeably noisier. Clearly,
that is not the case in Figure 10. Web sites that show a differences
between crop and full frame cameras are typically changing the lens
aperture area between cameras, thus the amount of light collected.
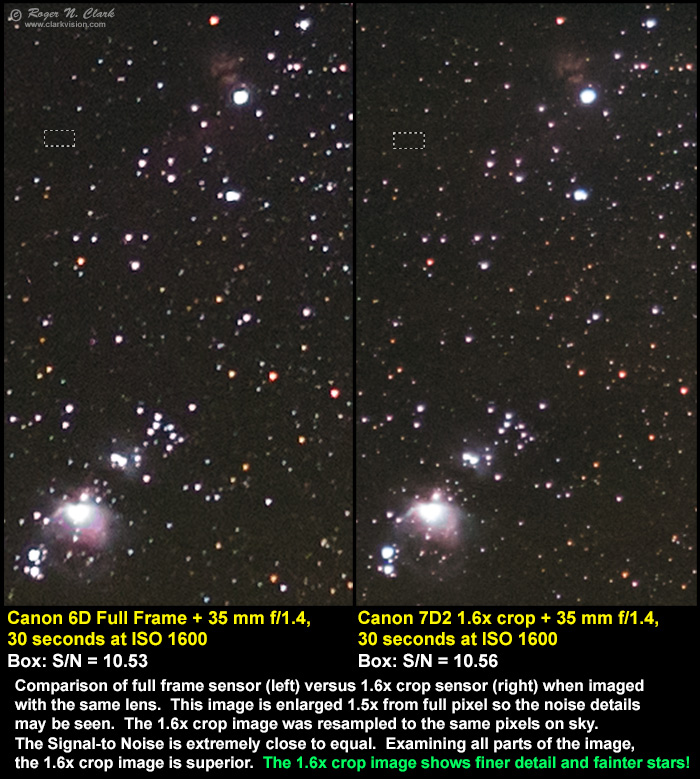
Figure 10. Comparison of images made with a full frame and 1.6x crop
cameras. The ratio of the pixel areas is 2.59. Focusing on the subject,
not the pixel (after all what is the subject in a photo: the subject,
or the pixel?), I binned the smaller pixels of the 1.6x crop camera
to the same pixels on subject in the full frame. By resampling to the
same pixels on the subject, we see that the signal-to-noise ratio (S/N)
is essentially the same in the uniform areas (agreement to better than
1 percent), but the smaller pixels of the crop camera actually record
fainter stars and more detail, even after resampling.
Figure 11 is another example using a 7D at ISO 6400, which produces
a quite noisy image. Compare that to the 5DII, with its larger pixels
produces an image with less apparent noise, but lower spatial resolution,
and then compare to the 7D with pixels scaled then averaged 2x2: a
pretty clean image in comparison. The scaling up by 1.35x does not
change the noise, and the 2x2 pixel average simply has the Etendue made
larger and equal to that for the 5D Mark II image. Note that the TOTAL
light from the subject is the same for the original 7D image and the
scaled, 2x2-pixel averaged image. The noise in the 7D resampled image is less because
the is more light per pixel in the resampled image. The noise also appears less in
the resized 7D image than that in the 5D Mark II image. This is because
the 7D sensor has slightly greater system sensitivity than the older
generation 5D Mark II, so the 7D collected a little more light, making
a higher signal-to-noise ratio image. This proves the 7D is actually
a better low light camera than a 5D Mark II.
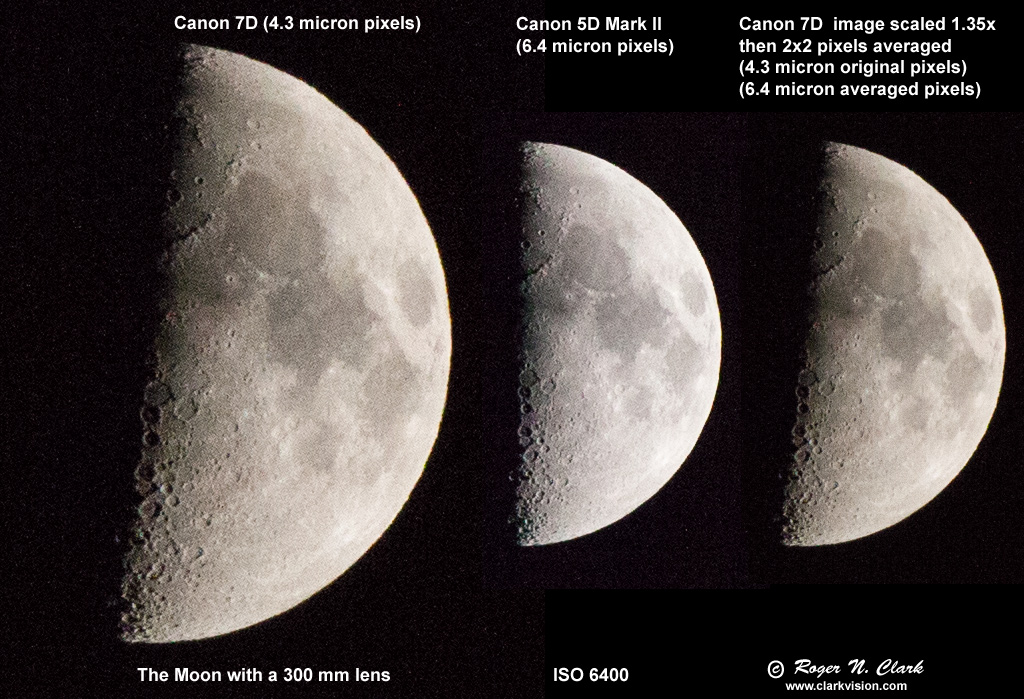
Figure 11. Comparison of 7D, 5DII and scaled 2x2 pixel averages of
the 7D image at ISO 6400. The 2x2 pixel average was performed in ImagesPlus.
This rescaling and pixel averaging make the 7D Moon image the same size as the
Moon in the 5D Mark II image. If the two cameras had equal system
sensitivities, the noise would be identical. The rescaled 7D image
on the right actually shows less noise than in the 5D Mark II image
because the 7D has slightly greater system sensitivity.
No sharpening and no noise reduction software was run on any image.
Another factor to consider regarding cameras is being able
to change lenses. Very fast wide angle lenses are only available in
single focal lengths (commonly known as prime lenses) with only a few
rare exceptions. Most zoom lenses are not as fast and produce lower
quality images (there are some exceptions). This generally means
a DSLR or mirrorless camera with interchangeable lenses. Note that
too much use of live view, whether mirrorless camera or DSLR heats the
sensor increasing dark current noise and that may make such comparisons
different. Once a sensor heats up, it can take a half hour or more to
cool back to ambient temperatures.
Another factor that may affect performance is pattern noise, or banding.
Older model cameras may have more banding problems than newer models
and the pixel rescaling my limit the effectiveness of comparisons
like that in Figure 10 and 11. But with modern low noise, low
banding cameras, one can trade spatial detail for noise, and pixel size
is less of a concern. Low light performance is dominated by the lens
collecting the light, not on pixel size and sensor size.
Discussion and Conclusions
I have demonstrated in this article that the lens aperture collecting
the light is the most important factor with modern cameras, not sensor
size or pixel size. This is true for many cameras, sensors sizes and
pixel sizes. A larger sensor enables one to use larger lenses to
collect more light. But if the same aperture diameter lens can be used
on a smaller format camera, then images can be virtually identical.
This concept is explored more in part 2.
But as one pushes extremes, either very small pixels, less than a
couple of microns, other factors come into play, including diffraction
which reduces contrast and detail, absorption lengths of photons in
silicon, and pixel dynamic range can limit the ability to get performance
obtainable with larger systems. For example, if one is using a fast lens,
like 50 mm f/1.4 on a full frame sensor, scaling down the sensor by 6x
would require a 6 times shorter focal length (8.3 mm), if one wants to
maintain the same field of view. With the same aperture diameter (35.7
mm) to maintain light collection, that would require an f/0.23 lens
(8.3/35.7)! Such lenses do not exist. The requirements to maintain
performance of a larger format system in a smaller format camera
increase as the format decreases, and at some point becomes impossible
or prohibitively expensive. The usual reason people buy smaller format
cameras is lower cost, lighter weight and smaller bulk; performance is
an afterthought.
For moderate systems, e.g. 1.6x crop versus full frame DSLRs, by understanding
the Etendue concepts presented here and elsewhere on this website,
one can in many cases get similar performance between the two systems.
This assumes one can maintain the lens aperture diameter on the
smaller system.
Small versus large pixels matter less in modern sensors: with the low
noise (read noise and camera electronics noise) available in many of
today's cameras (circa 2014+) one can synthesize large pixels from a
sensor with small pixels obtaining similar (or even better) performance.
This was not always the case. Older digital cameras had high read noise
and high camera electronics noise. Adding pixels together meant adding
significant noise, limiting the effectiveness of larger pixel synthesis.
In the near future, read noise + downstream camera electronics noise
should be significantly below 1 electron (circa 2014+ it is typically
1 to 3 electrons in some cameras). Below one electron one can pretty
much rely on post processing to trade noise with spatial resolution at
the lowest light levels. Such post processing binning is being done
today (2015+) but with a small amount of added noise when adding pixels
together (Figures 10, 11).
We do observe a difference in image quality in the images output from
a camera with larger versus small pixels. But such difference can be
effectively mitigated in post processing as illustrated in Figures 10 and 11.
When choosing between cameras with the same sized sensor but differing
pixel counts, times have changed. A decade ago, I would have chosen
the camera with larger pixels (and fewer total pixels) to get
better high ISO and low light performance. Today I would choose the
higher megapixel (thus smaller pixels). Modern cameras with high
megapixel count, low read noise and low electronics noise allow one to
trade resolution and noise. If one wants reasonable dynamic range
in a high megapixel camera, the pixels must still be large enough to
hold enough photoelectrons to give the dynamic range. Currently (circa 2016),
that is not much smaller than 4 micron pixel spacing. For example,
the 50 megapixel Canon 5DS(r) fits this criteria, and Nikon's D800 and D810
are in the same league.
Pixels smaller than 4 microns
can often be limited (lower contrast and loss of fine detail) by diffraction.
But now that system noise is low in modern cameras, adding pixels together
to synthesize an image from a sensor with larger pixels, diffraction limited
smaller pixels is less of a concern.
Do note, however, that photoshop (CS6 to CC) currently does not have pixel
binning tools. If you want to do pixel binning, look at astronomical image
processing programs.
See also:
Characteristics of Best Digital Cameras and Lenses, and
Film Versus Digital Executive Summary.
Also, see the article
Dynamic Range of an Image
which shows that real scenes can have over 10 photographic stops of
dynamic range (a factor of over 1000).
Then explore the article on
The Signal-to-Noise of Digital Camera
images and Comparison to Film.
If you find the information on this site useful,
please support Clarkvision and make a donation (link below).
Notes and References
This page shows images and noise graphs of some point and shoot digital cameras
compared to a DSLR. The results are similar to the research presented on this page.
http://www.dpreview.com/reviews/sonydscf828/page14.asp
DN is "Data Number." That is the number in the file for each
pixel. I'm quoting the luminance level (although red, green
and blue are almost the same in the cases I cited).
16-bit signed integer: -32768 to +32767
16-bit unsigned integer: 0 to 65535
Photoshop uses signed integers, but the 16-bit tiff is
unsigned integer (correctly read by ImagesPlus).
The fundamental error in measuring a photon signal is the square
root of the number of photons counted, Poisson Statistics.
The maximum number of photons one can count with a sensor
is the max number of electrons in that can be held in the well.
There is one electron per photon. If one fills the pixel
well with 40,000 electrons, then the noise in the signal is
square root 40,000. So whatever the signal is, the error
(noise) is square root of the number of electrons (photons).
The more photons counted, the higher the signal-to-noise.
The signal-to-noise = # photons/square root(# photons)
= square root(# photons)
In the shadows in an image, one may get only a few hundred
photons, so the noise is square root of those few hundred.
The Poisson Distribution http://mathworld.wolfram.com/PoissonDistribution.html
Signal-to-Noise Ratio in digital imaging:
http://www.photomet.com/library_enc_signal.shtml
Photon noise:
http://www.roperscientific.de/tnoisesrc.html
Canon's Powershot S60 camera report.
http://www.canon.com/camera-museum/tech/report/200408/report.html
CMOS Fill Factor explained:
FillFactory's High Fill Factor N-Well Pixel® (US Patent 6,225,670)
http://www.fillfactory.com/htm/technology/htm/high_fill.htm
When digital cameras need large pixel areas
http://www.kodak.com/global/plugins/acrobat/en/digital/ccd/papersArticles/interlineLargePixels.pdf
The Two Classes of Digital Cameras
http://www.kenrockwell.com/tech/2dig.htm
More on the f/ratio Myth:
http://home.earthlink.net/~stanleymm/f_ratio_myth.htm
NOTE: This is part 1 in a series. Part 2 is at:
Digital Cameras: Does
Pixel Size Matter? Part 2: Example Images using Different Pixel
Sizes.
http://clarkvision.com/articles/does.pixel.size.matter
First Published February, 2005.
Last updated July 12, 2016.