ClarkVision.com
| Home | Galleries | Articles | Reviews | Best Gear | Science | New | About | Contact |
The Color of Stars
by Roger N. Clark
| Home | Galleries | Articles | Reviews | Best Gear | Science | New | About | Contact |
by Roger N. Clark
What color are stars in the night sky? Stars show a lot of color and that color can be seen with your eyes. Your digital camera can also show the colors of stars.
The Night Photography Series:
Contents
Introduction
The Spectral Color of Stars
Stars in the Sky
The Tycho 2 Star Catalog
Conclusions
References and Further Reading
Stars display a wide range of colors, determined by their temperature and composition: their spectral type. Astronomers invented a scale from hottest to coolest stars: O, B , A, F, G, K, M. The scale is further divided by a number 0 to 9. For example, an F5 is half way from F to G. Our sun is a G2 star. The hottest stars are bluish, the coolest, M stars, are orange/red.
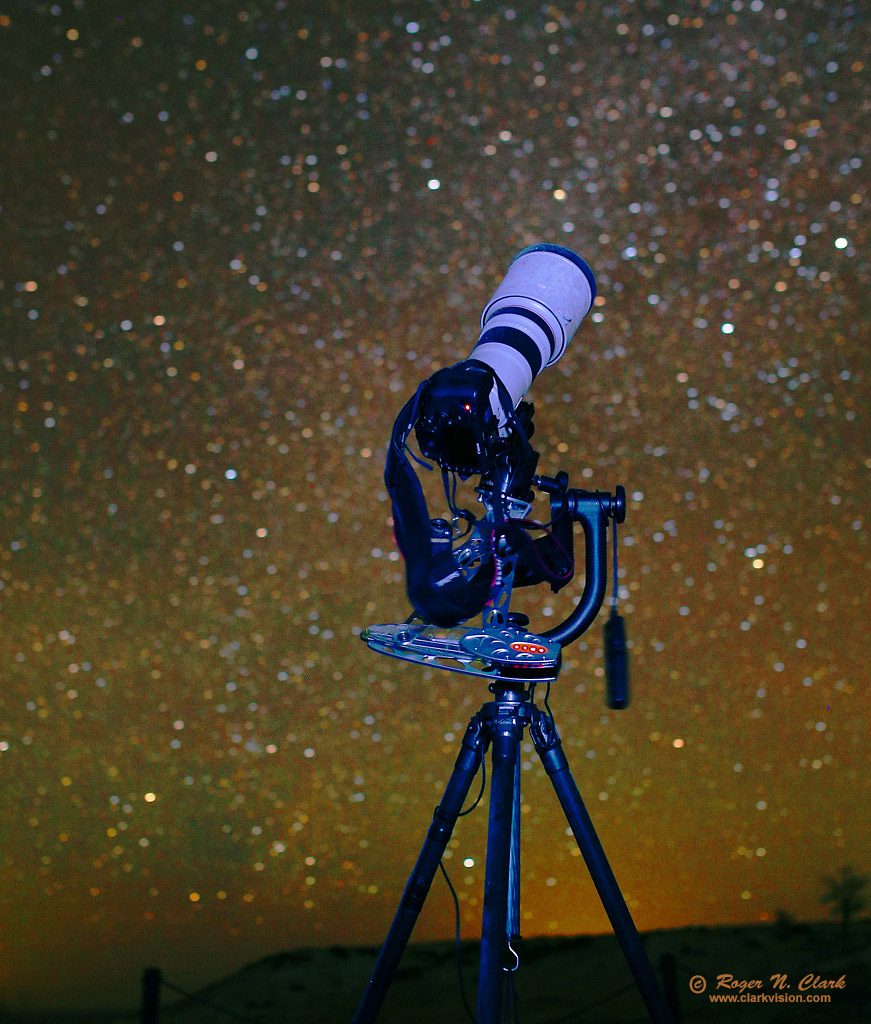
What colors do different stars actually show? When a star is in focus, it is easy to overexpose a star, But out of focus, the disk of a star and its color are easier to record. Figure 1 shows such an example. In Figure 1 we see disks of light blue, yellow, white, orange and red. But are these colors accurate? What colors should we expect?
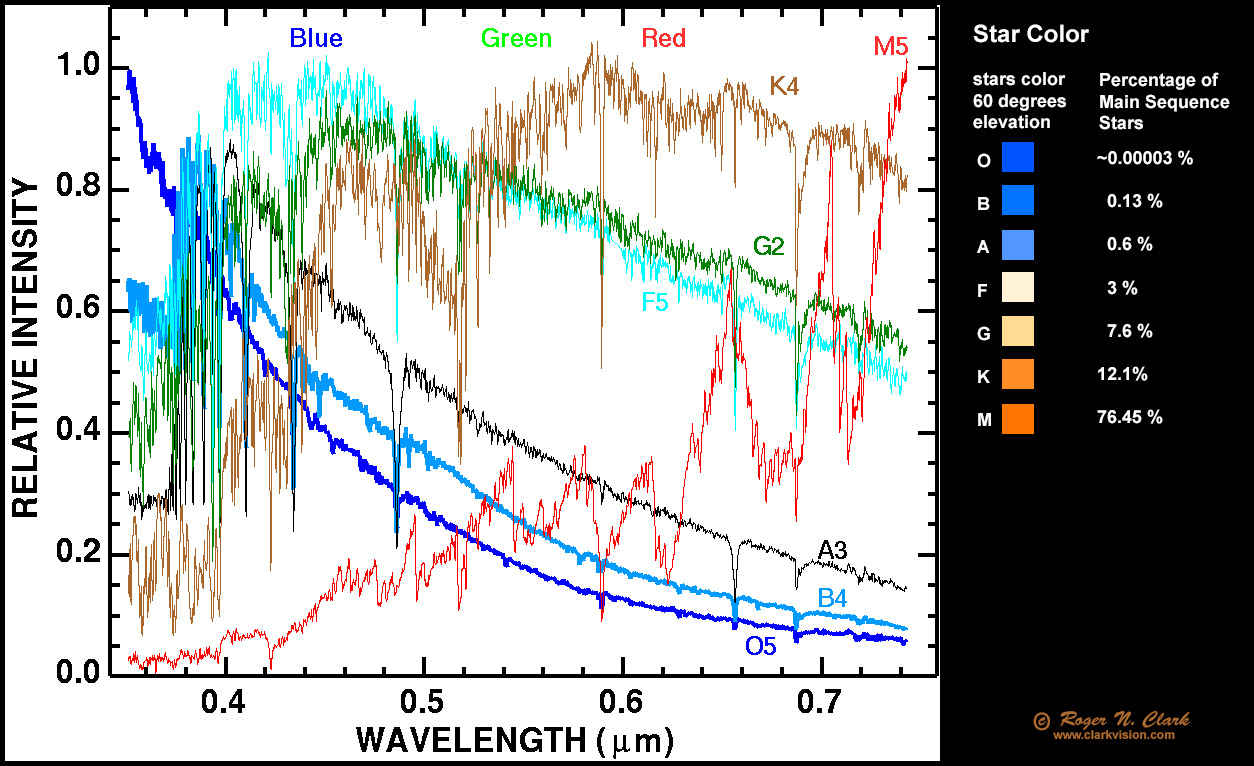
The colors can be accurately modeled using stellar fluxes as a function of wavelength (Figure 2), the transmission of the Earth's atmosphere, and the known response of the human eye.
Another factor in our perception of star colors in the night sky is the number of stars of each color in the Milky Way Galaxy. There are many more cool yellow stars than there are very hot bluish stars. The key in Figure 2 shows the number of Main Sequence stars by spectral class. The bluest O-type stars number less than one in a million. Most of the "blue" stars are spectral type A, which appear bluish-white, consistent with the colors in Figure 1.
Representative spectra of stars are shown in Figure 2a. These spectra are from Jacoby et al. 1984 (reference below) and the spectra are as would be seen above our atmosphere without any of the effects of the Earth's atmospheric transmission. Our atmosphere preferentially absorbs blue light making stars appear yellower than if we could observe them in outer space. The star colors on the right were computed from the spectra in the Figure and multiplied by the average transmission of the Earth's atmosphere for a star altitude of 60 degrees, multiplied by the spectral response of the human eye (1931 standard) and integrated to determine the response for red, green and blue.
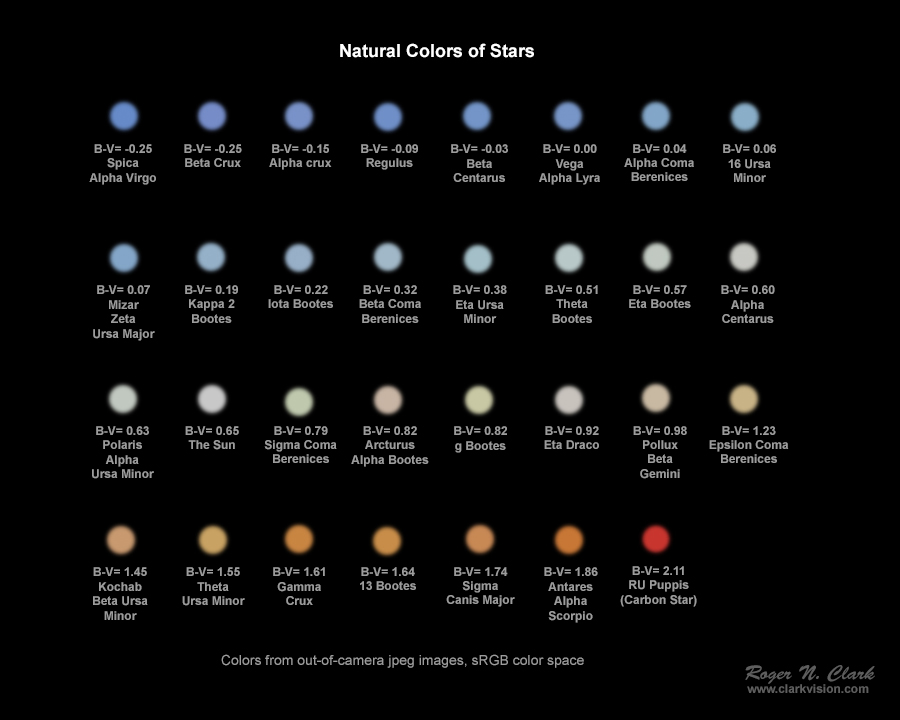
The composite shown in Figure 2b was derived from out-of-camera jpeg images of out-of-focus stars made with a stock digital camera. De-focus the stars into small disks to help visually show the colors. Astronomers measure the stellar magnitudes of stars through different filters, commonly U, B, V, R (ultraviolet, blue, green, visible, and red) filters. The V filter is close to the green in a consumer digital camera. The blue filter includes blue of the visible spectrum plus some ultraviolet. The B-V index is an approximate indicator of color. Note the index is not an exact color indicator because of differing spectra of stars and the B and V filters are not an exact match to digital camera filters nor human eye spectral response. Note too that there are no green stars. Fewer than 1% of stars in our galaxy have blue natural color.
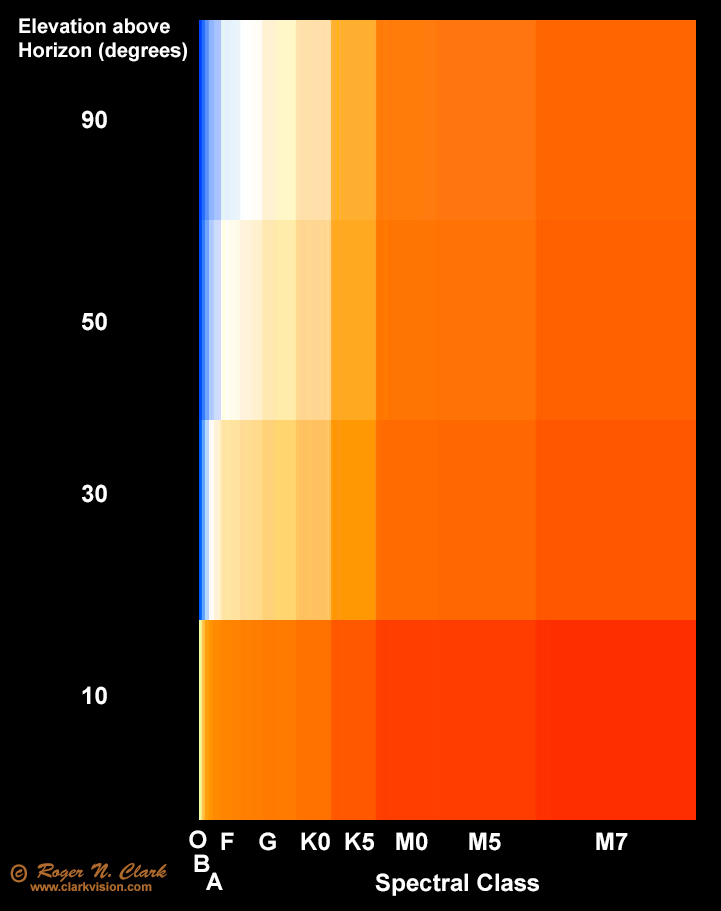
The colors in Figure 2a illustrate some of the colors of stars. But using a larger data set of star spectra from Jacoby et al. 1984 and using the proportion of spectral types in the sky (the values in Figure 2a, right side), I computed the colors of stars from overhead to 10 degrees above the horizon and the results are shown in Figure 3. This Figure illustrates that the preponderance of stars in the sky will be whitish to yellow, orange, and red. The colors will become yellower/redder as the star approaches the horizon, much like our sun does toward sunset.
Next time you are out under a dark night sky use a pair of binoculars to make the stars out of focus and see how many colors you can see. Be sure and get very dark adapted first by using no lights, not even a red one, for at least a half hour. You should be able to see colors similar to those shown in Figure 3 and that the stars appear yellower lower down.
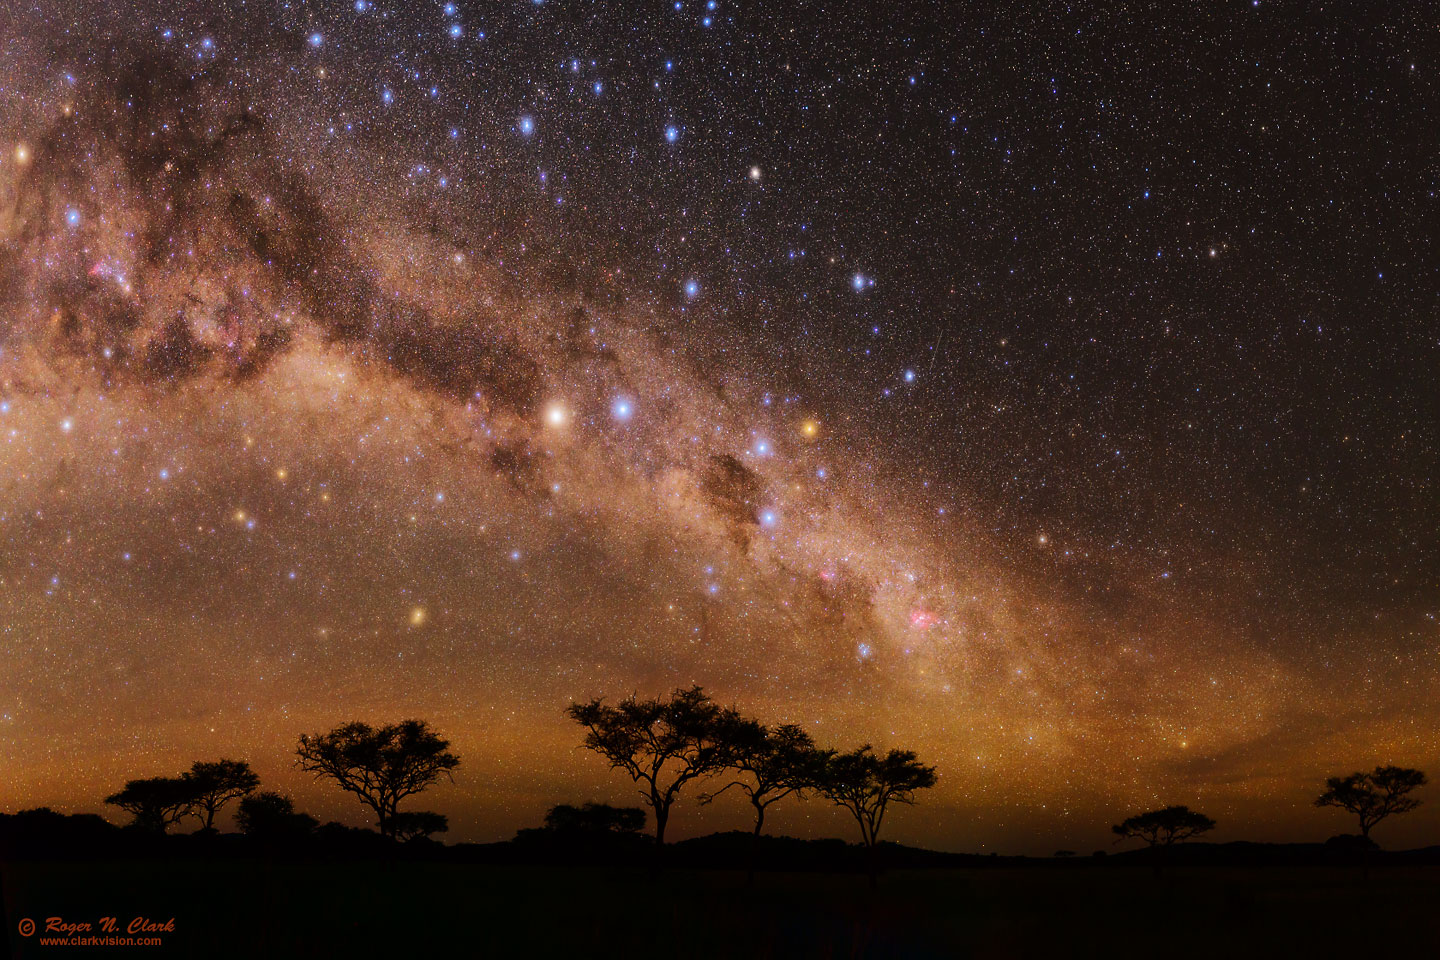
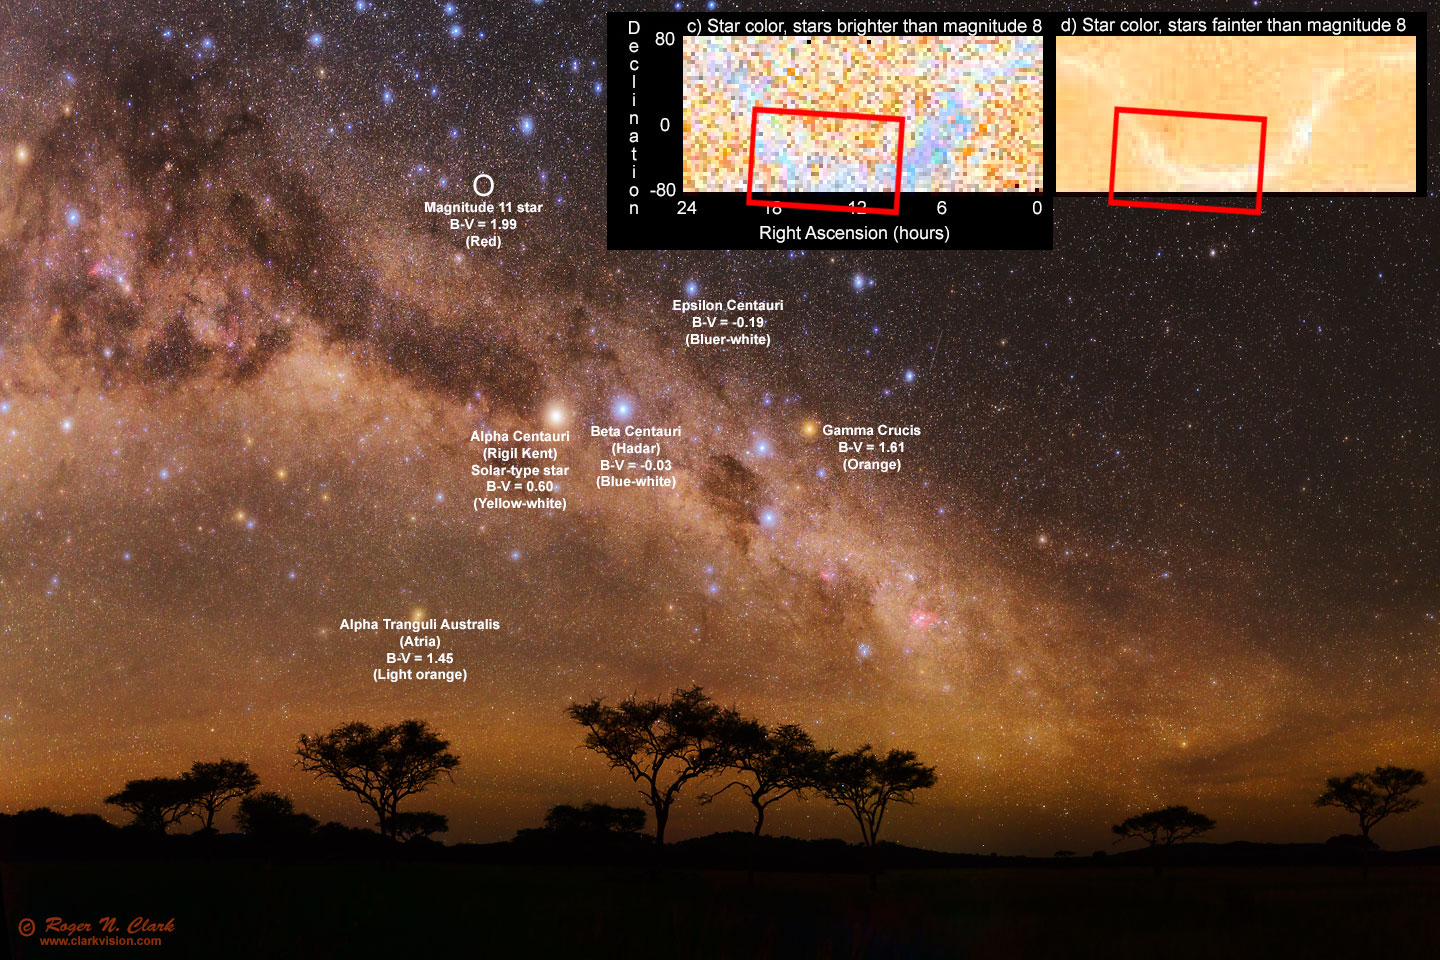
Putting the above information to work, consider the image in Figure 4, made from the central Serengeti in February 2015. Note the 3 trees in the middle on the horizon. Above the tallest of those 3 trees, in the center of the image is a bright blue star and to its right is a yellowish-white star. The yellowish-white star is Alpha Centauri, a G2 star whose spectral class is close to our Sun. Thus we would expect that star to appear yellowish-white when low in the sky (30 degrees elevation; compare with Figure 3). The bright blue star to the right of Alpha Centauri is Beta Centauri, a B1 spectral class which we would expect to look blue. To the right of Beta Centauri is the Southern Cross. The top star in the Southern Cross is the orange star Gamma Crux, spectral type M3, which from Figure 3 should appear orange. It does appear orange to the unaided eye. The bottom star of the Southern cross is Beta Crux, spectral type B0. The left point of the cross is Alpha Crux, another B0 star. B0 stars should appear blue, and that is what we see in this image.
Other colors in the Figure 4 image include many reddish-pink emission nebulae, and brown dust pervasive in the Milky Way. Nearer to the horizon, the stars appear yellower similar to the way our Sun appears yellower when near the horizon. The digital camera with a daylight color balance has accurately recorded the natural colors in the night sky.
Note some astrophotographers modify digital cameras for increased red response. Such modifications includes longer wavelength than can be seen with the human eye and boosts the far red response out of proportion to the human eye. Such cameras record what is called false color, because it includes wavelengths of light beyond what can be seen with our eyes. Such cameras would make the stars appear redder than true color.
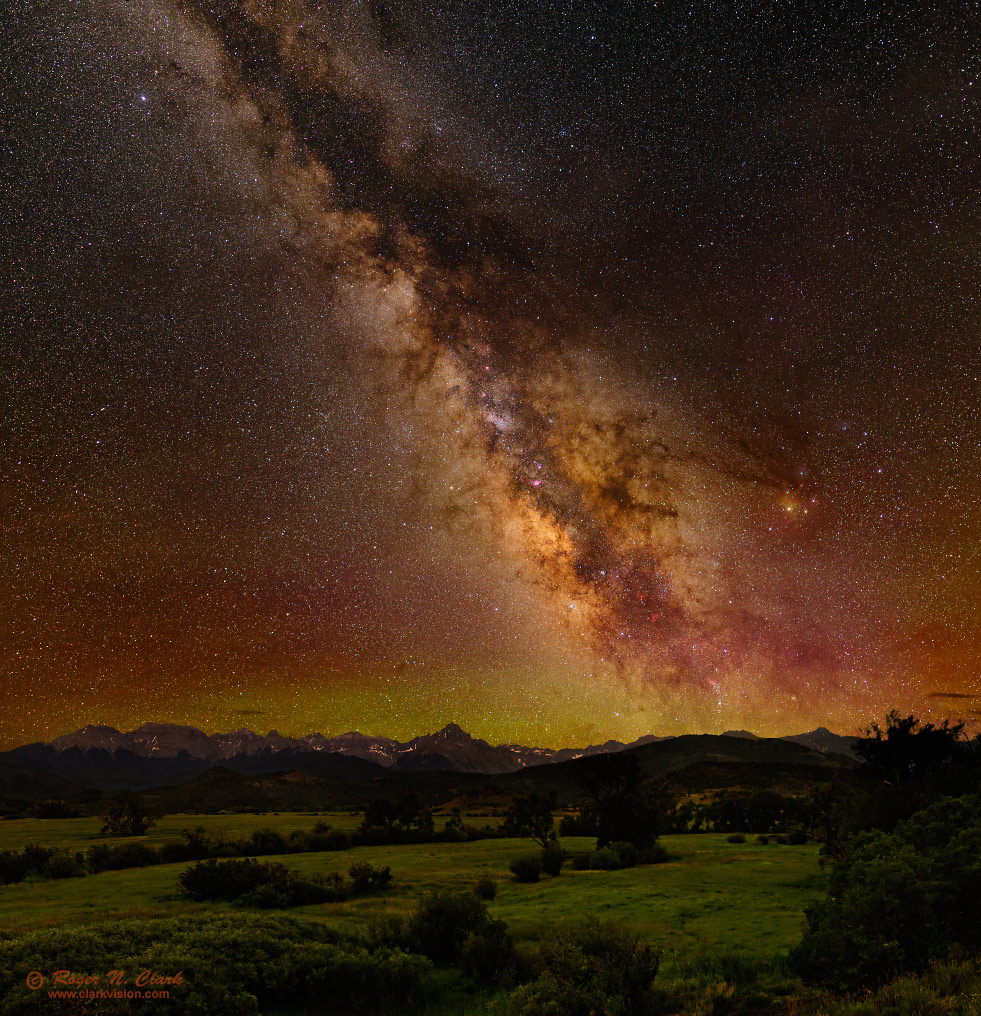
The Milky Way more familiar to northern hemisphere observers is shown in Figure 5. The center of our Milky Way galaxy is the brightest blob just to the lower right of center. Key elements to the color balance is the Milky way shows the same basic colors from the brightest to the faintest parts of the Milky Way. The center of the galaxy is dominated by cooler yellow to red stars. The outer spiral arms, toward the top of the image, has more bluish stars, but yellow and red stars still dominate the stellar population there too. The bright star near the upper left corner is Altair in the constellation Aquila, a star with spectral type A7, which should appear bluish-white, and that is what the image shows. The bright orange-red star Antares in Scorpio (lower right in Figure 5) appears orange-red to the unaided eye and that is what the image shows.
We commonly see Milky Way photos on the internet that show blue in the fainter portions of the Milky Way, including around the galactic center. sometimes the color is intense blue, and even purple with poor post processing. That is a sure sign that the photographer used white balance to correct light pollution or reduce airglow. Light pollution and airglow are added light, so should be subtracted. White balance is a multiply: multiply the intensities in the red, green and blue channels using different factors to change which colors are brightest. But white balance corrections for light pollution and airglow do not produce a neutral balance. It produces a bluing/purpling of the scene as intensities become lower as typically implemented, as many online tutorials and some pro photographers teach (that is really bad). I can tell just about every image produced on the internet that uses color balance to "adjust" the image to reduce light pollution and/or airglow. These images are now so common, that the color scheme has become its own truthiness and photographers are growingly thinking this is the true night sky. The key things in such images are the outer portions of the Milky way turn blue in images where white balance is used to correct light pollution. Depending on the severity of the light pollution, the white balance correction can result in blue to purple colors in the fainter parts of the Milky Way. This is easily avoidable with better post processing methods, described in Part 3 in this series.
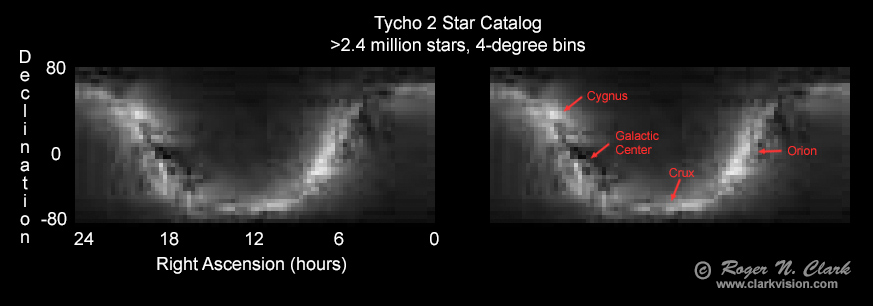
Actual star counts by spectra class can be found in star databases. The Tycho 2 catalog contains over 2.4 million stars to visual magnitude 15.2 with star colors (B and V magnitudes). A histogram of star color is shown in Table 1. The color observed in our night sky will be redder than the values in the table, which have been corrected for absorption by our atmosphere. In any case one can see that there are very few blue stars and that the average star is white to yellowish white with many orange and orange-red stars. With so few blue stars, the natural night sky looks more like that shown in Figure 4 than the all too often blue Milky Way we see today in amateur astrophotos.
                  Table 1

Tycho 2 database, 2,430,374 stars  magnitude V 2.05 to 15.2
http://tdc-www.harvard.edu/catalogs/tycho2.html

    Color
      B-V    Number of Stars
     -2.4          4
     -2.3          2
     -2.2          5
     -2.1          5
     -2.0          4
     -1.9          8
     -1.8         14
     -1.7         20
     -1.6         37
     -1.5         47
     -1.4         57
     -1.3        119
     -1.2        190
     -1.1        296
     -1.0        424
     -0.9        767
     -0.8       1109
     -0.7       1808
     -0.6       3055
     -0.5       5010
     -0.4       8158  Blue                  b-v =-0.33: O5V    ~42,000 K
     -0.3      13159  Deep Blue-White     B0V    ~30,000 K   (B-V = -0.30)
     -0.2      23521
     -0.1      45616
      0.0      76357  Blue-White          A0V     ~9,800 K   (B-V = -0.02)
      0.1     105827
      0.2     134717
      0.3     168902  White               F0V     ~7,300 K   (B-V = 0.30)
      0.4     205831
      0.5     217000
      0.6     193206  Yellowish-White     G0V      ~5,940 K  (B-V = 0.58)
      0.7     156765
      0.8     124677  Pale Yellow-orange  K0V       5,150 K  (B-V = 0.81)
      0.9     108664
      1.0     109187
      1.1     115567
      1.2     111691
      1.3      97171
      1.4      80262  Light Orange-Red    M0V       3,840 K  (B-V = 1.40)
      1.5      65384
      1.6      54335
      1.7      45887
      1.8      38363
      1.9      31775
      2.0      22922
      2.1      16157
      2.2      11864
      2.3       8599
      2.4       6488
      2.5       4806
      2.6       3568
      2.7       2610
      2.8       1941
      2.9       1460
      3.0       1145
      3.1        856
      3.2        676
      3.3        497
      3.4        364
      3.5        302
      3.6        223
      3.7        193
      3.8        158
      3.9        124
      4.0         91
      4.1         80
      4.2         54
      4.3         54
      4.4         43
      4.5         27
      4.6         24
      4.7         16
      4.8          5
      4.9          6
      5.0          3
      5.1          6
      5.2          2
      5.3          2
      5.4          1
      5.5          0
      5.6          0
      5.7          1
      5.8          0
      5.9          1
      6.0          0
      6.1          0
      6.2          0
      6.3          0
      6.4          2

B-V color index: http://en.wikipedia.org/wiki/Color_index
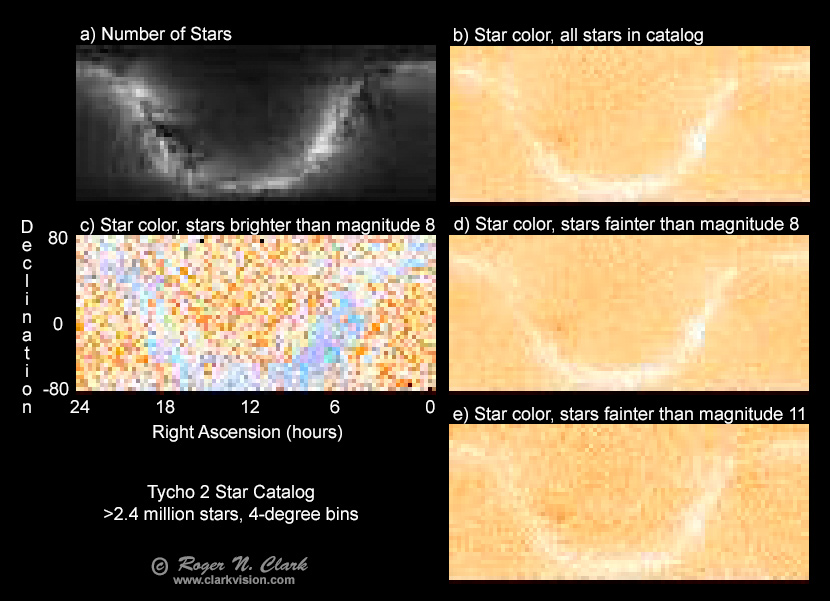
I wrote a program to bin the Tycho 2 catalog data into 4-degree bins to examine the distribution of star colors over the sky. The relative number of stars in the catalog in each 4-degree bin is shown in Figure 6. The color results are shown in Figure 7. The data show that for all stars in the catalog, Figure 7b, there are relatively more white stars along the galactic plane, but the average star is yellowish to orange away from the galactic plane. Note this is in direct conflict with the all too common blue color in astrophotos of the Milky Way seen on the internet. If we look only at brighter stars, Figure 7c, we see there are relatively more bright blue O and B stars. This is exactly what is seen in Figures 4 and 5, above: bright bluish-white stars. But as we look at fainter stars, Figure 7d, we see that the dominant star color is white in the galactic plane except yellow-orange around the galactic center, and yellow to orange away from the galactic plane. If we look at fainter stars, Figure 7e, we see the dominant star color becomes redder.
The data in the star catalog clearly shows that the dominant star color away from the plane of the Milky Way galaxy becomes redder, not bluer as seen in many astrophotos. The star catalog data only shows star colors. Add the orange/brown dust, and red hydrogen emission nebulae, and the overall color of the galaxy is on the red end of the spectrum, not blue. The dominant reddish color of the dust and fainter stars is sprinkled with bright bluish stars, like that in Figure 4. Figure 8 shows the Serengeti scene with location diagram on the Tycho 2 color map.
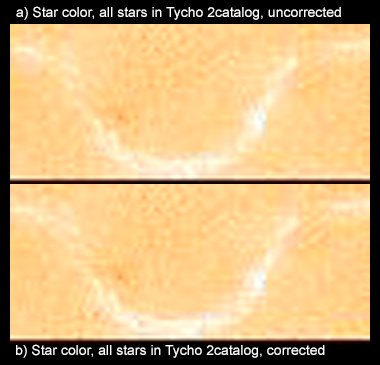
Well, the internet "experts" are at it again. This time they question the Tycho 2 data, citing this web site: http://www.britastro.org/asteroids/Tycho%20Photometry.htm which discusses that the photometry in the Tycho 2 catalog does not quite match the response of the standard B (blue) and V (visual) system. The above web site derives a correction. What the internet "experts" fail to realize is that the corrections are small and only change slightly the colors. Figure 9 shows panel b from Figure 7 (uncorrected Tycho 2 data) and a corrected version of the Tycho 2 data (Figure 9b) using the correction equations. Can you tell a difference? There is a very small color difference. It made the bluest regions less blue. That is exactly the opposite of what the internet experts were trying to do to disprove in the Tycho 2 data. The results in Figure 9 clearly show little difference and are of no significant impact to the conclusions of this study, including that the Milky Way stars appear redder away from the plane of the galaxy.
The night sky is full of wonderful colors, and those colors span the spectrum, from a few bluish stars to white, yellow, orange and red stars. Add in the red, pink, blue and green nebulae and brown dust and the deep night sky beyond the Earth's atmosphere and we see the night sky displays an amazing range of colors. Add in the colorful natural airglow in the Earth's upper atmosphere, and night sky images are warm and gorgeous with amazing colors. The best way to show that color range is a daylight white balance on your digital camera. Before digital cameras, astrophotographers used daylight balanced color film to record the night sky. Colors recorded with a daylight white balance record what we can observe in star colors with our eyes, with binoculars and with telescopes and show a beautiful universe.
Resist the temptation of the recent fad in digital night photography to color everything in the night sky blue. It is really much more interesting and colorful.
Predominant on the internet is the idea to use color balance to correct light pollution. Light pollution is added light so needs to be subtracted. Color balance is a multiplicative process and when used to "correct" light pollution commonly results in a shift in color balance with different intensities. That typically shows as a blue/purple glow around the Milky Way. That is a sign of poor post processing. Figures 4 and 5 show no such blue as the Milky Way fades, and neither does the star catalog data. Note that the image in Figure 4 was made in one of the darkest sites on Earth: the central Serengeti. There was no light pollution. The yellow-orange near the horizon is airglow. The image in Figure 5 had minimal light pollution, being made from a dark location in Colorado, but moderate airglow was present. The next article in the series, Part 3, shows how to subtract light pollution.
References and Further Reading
Clarkvision.com Nightscapes Gallery.
Jacoby, G. H., Hunter, D. A., and Christian, C. A., L Library of Stellar Spectra, The Astrophysical Journal Supplement Series, 56, p. 257-281, 1984. Spectra with corrections through May 2014. Article and data can be found here (for digital data follow the SIMBAD Objects link).
The Night Photography Series:
| Home | Galleries | Articles | Reviews | Best Gear | Science | New | About | Contact |
http://clarkvision.com/articles/color-of-stars
First Published May 2, 2015
Last updated August 23, 2021