Digital Camera Tone curves
(Camera Response Function)
(Opto-Electronic Conversion Function (OECF)
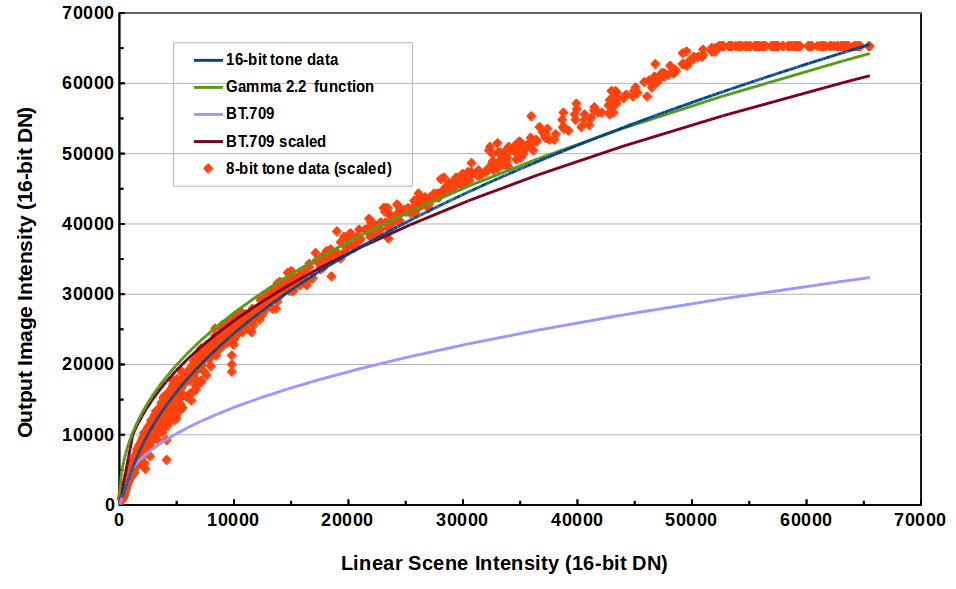
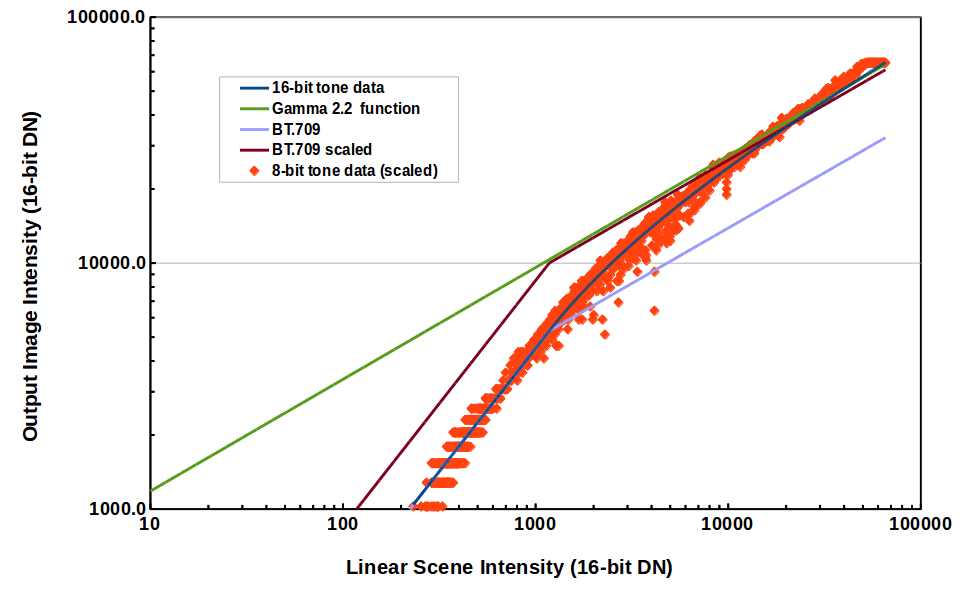
Figures 1a, 1b illustrate that the standard tone curve, a simple gamma 2.2 function
or a BT.709 tone curve do not match actual output from a digital camera.
Nor is it expected, see references.

Figure 1a. Digital Camera Tone Curves:
Dark blue line: 16-bit tiff data from DCRAW (actual camera data).
Red points: 8-bit default tone curve from DCRAW (actual camera data).
Green line: gamma 2.2 function.
Light purple line: BT.709 tone function from wikipedia.
Dark purple line: BT.709 tone scale to better match data.

Figure 1b. Same as Figure 1a, but log log plot.
References
Garcia JE, Dyer AG, Greentree AD, Spring G, Wilksch PA (2013) Linearisation of RGB
Camera Responses for Quantitative Image Analysis of Visible and UV
Photography: A Comparison of Two Techniques. PLoS ONE 8(11): e79534. doi:10.1371/journal.pone.0079534
http://paperity.org/p/60767995/linearisation-of-rgb-camera-responses-for-quantitative-image-analysis-of-visible-and-uv
"camera responses... successfully fitted the entire characteristic curve of the tested devices,
allowing for an accurate recovery of linear camera responses."
"Linear responses from consumer-level cameras can be recov-
ered by fitting a function to a plot of camera response versus
incident radiance, the Opto-Electronic Conversion Function curve
(OECF), and subsequently inverting the fitting function via
analytical or graphical methods, or look-up tables (LUTs) [19].
Polynomial, power and exponential functions have been previ-
ously suggested as fitting functions [20,21]."
"Here we compare the use of (parametric) cubic Be ́zier curves
and biexponential functions for characterising two camera models"
"In spite of
being sensitive to different regions of the spectrum, the OECF
curves of the two tested cameras present a notable similarity in
their general form. This result indicates a close likeness
between the gain functions applied to the sensor response of the
two cameras."
http://profs.info.uaic.ro/~vcosmin/licenta/lucrari_licenta_in_desfasurare/HDR/ebooksclub.org__High_Dynamic_Range_Imaging__Acquisition__Display__and_Image_Based_Lighting.pdf
Assuming an sRGB response curve (as described in Chapter 2) is unwise,
because most makers boost image contrast beyond the standard sRGB gamma to
produce a livelier image. There is often some modification as well at the ends of the
curves, to provide softer highlights and reduce noise visibility in shadows.
http://www.ee.columbia.edu/ln/dvmm/publications/PhD_theses/jessiehsu_thesis.pdf
Image Tampering Detection For Forensics Applications
PhD These, Columbia U, 2009
"Camera Response Function (CRF), pages 37-38:
The CRF is often denoted as a single-variable function
R=f(r). Although diffㄦent manufacturers may produce diffㄦent
dynamic ranges of irradiance r and brightness R, without
loss of generality, both r and R are assumed to be between [0,1].
Some popular parameterized models are listed as follows:"
PCA-based empirical model of response (EMOR) [31]
Single-parameter gamma function R=f(r) = r^a0 [32]
Polynomial R = f(r) = SUM n=0 to N r^Bn [33
Generalized gamma curve model (GGCM) R =f(r) =r SUM i=0 to n ai *r6^i [34, 35]
"Generally, more parameters lead to more accurate representations of the CRF with
the drawback of increased complexity. Therefore one should choose an optimal
model considering the tradeoâetween approximation accuracy and computational
complexity. A comparison among these models is given in [34] and [35]. The EMOR
and GGCM have been shown to approximate CRFs better than the gamma and
polynomial models."
the above reference 31 is:
[31] M. D. Grossberg and S. K. Nayar. What is the space of camera response
functions? IEEE Conference on Computer Vision and Pattern Recognition, 2003.
http://www1.cs.columbia.edu/CAVE/publications/pdfs/Grossberg_CVPR03.pdf
"a camera's response function can vary significantly from an analytic form like a gamma curve."
Last updated June 28, 2015

